HDFCAMC - Rounding Bottom after a smooth Rally - IntradayThis analysis is done purely on basis of price action and chart patterns.
The analysis is done on 15 min TF hence target can be achieved same day or in a couple of days
Logic, Entry range, SL and Target is shown in image itself.
This analysis is for study purpose. Traders must do their own study before entering into any trade. Traders should trade with their own risk capacity and money management.
Feel Free to comment for any query or suggestion regarding this stock or Price Action Analysis
To understand how rounding bottom gives a blast move on breakout -
Check below case of BALMLAWRIE and DHANUKA for examples of Rounding Bottom Pattern
Roundingbottom

DHANUKA - Rounding bottom + Bull Flag/Pennant - SwingThis analysis is done purely on basis of price action and chart patterns.
The analysis is done on Daily TF hence it can take couple of days to couple of weeks to reach the target.
Logic, Entry range, SL and Target is shown in image itself.
Reasons for stock selection & going long in this stock - Debt free company, Good performance, posted highest revenue/profit in Sept Quarter and Q3 is also expected to be good.
(Buy on rumors & sell on news strategy)
This analysis is for study purpose. Traders must do their own study before entering into any trade. Traders should trade with their own risk capacity and money management.
Feel Free to comment for any query or suggestion regarding this stock or Price Action Analysis
Check below another idea of BALMLAWRIE for another example of Rounding Bottom Pattern

BALMLAWRIE - Rounding Bottom - Weekly chart - SwingThis analysis is done purely on basis of price action and chart patterns.
The analysis is done on weekly TF hence it can take couple of days to couple of weeks to reach the target.
Logic, SL and Target is shown in image itself.
Also, traders can see Cup & Handle formation on chart as well. (double confirmation of priceaction)
This analysis is for study purpose. Traders must do their own study before entering into any trade. Traders should trade with their own risk capacity and money management.
Feel Free to comment for any query or suggestion regarding this stock or Price Action Analysis

ACIA seems to ready for another runNASDAQ:ACIA consolidated side ways for quite some time and seems to be ready for a bullish move. Targets 79$, 86$~91$ zone and then 100$. Stop can be placed at 66$.
Hit the like button please if you find this useful :)
This is only my own view and not a financial advice, do your own analysis before buying or selling
Happy Trading!

TATA CONSUMER - Rounding Bottom (Consolidation in Uptrend)Price has formed rounding bottom and can give a breakout above 592 and enter into uncharted territory, price has also been taking support of 9 day EMA since November, currently also price has bounced from the same EMA.
Pattern Target is 130 points post Breakout
VIEWS FOR LEARNING PURPOSE ONLY

Coal India - Weekly/Daily Trendline BO with rounding bottomCoalindia is very interesting candidate, given breakout on weekly and daily trendline and forming a roundling bottom, need to break neckline for further upmove as its in daily supply zone. As per my experience it will retrace and test back broken trendline and demand zone ... Lets see how it react... Target on chart...

Drreddy - Roundling BottomDrreddy retraced at golden ratio and forming round bottom. on verge of breaking neckline, RSI just crossed 60. Showing a powerfull momentum. Targets on chart...

PNB - Round Bottom BOPNB broken round bottom neckline with super huge volume. It might test neckline before giving upmove. Targets on chart...

HDFCLIFE - Round Bottom BOHdfclife given breakout on round bottom and retested with huge volume rejection, Journey to all time high started. Targets on chart...

CRV round bottom with iSHS could bring a x10Here I share you this idea
It seems extreme, because it is.
Enter slowly and wait some weeks, we will have results.
All the information is in the chart.
Cheers!

SBIN - Medium Long Term StructureAfter a long time, the worst in banking space as a whole seems to be over. This was apparent with the trending move in Nov in the index and all banks.
With amazing results posted by SBIN during the previous quarter seems like this is well headed for stability and solid up move.

BUY BOROSILabout to complete its rounding bottom pattern with high volumes
strength in momentum also.
TARGET 1: 180
TARGET 2: 200
STOP LOSS : 150
**These are my personal observations. Please trade at your own risk.**

ETH/BTC ACCUMULATION Alright ill keep it short because this is about to exlpode!
-Huge rounding bottom = more demand = accumulation
- higher highs and higher lows
- Massive hidden bullish divergence on the weekly
- eth/usd looks amazing too
- Back-tested the spring
-If we break the neckline shown, there is little resistance on the way up
LETS GO ETHERIUM
This is not financial advice, please do your own research before opening a position.

Live Intraday Trading - Trading a rounding bottom pattern !!A nice rounding bottom formation in the stock , in the same direction of the market . After a very nice trade in TCS , I did not wanted to hold for longtime . Got a very nice profit and then got away !!

Atlas Copco B Idea on the daily timeframeLong trade can be taken above 380 SEK
Stock is above 200 periods movile average
Rounding bottom or saucer pattern completion around 380
RSI getting better
Good luck!

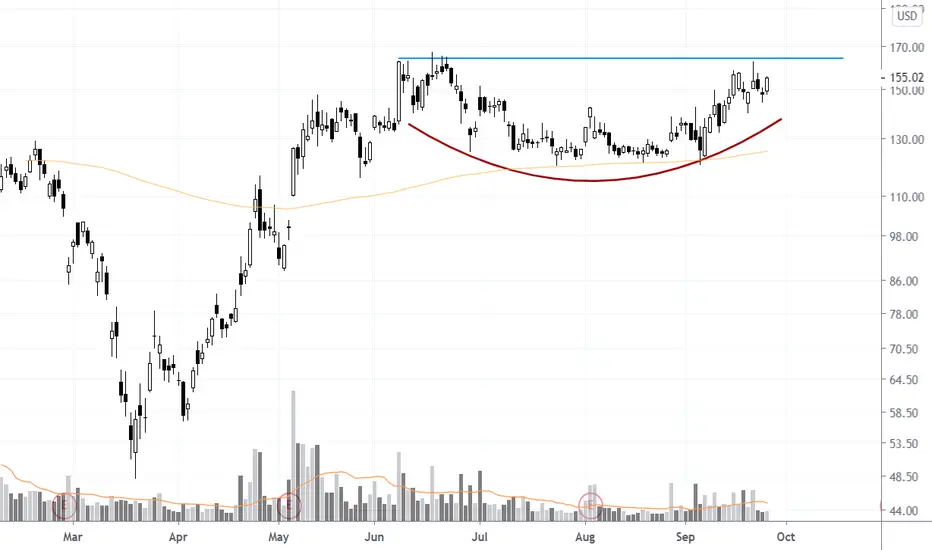
$BYND Looks Ready to Breakout from 4 Month Rounded formationNASDAQ:BYND been working on a 4 month rounded formation that is bringing the stock back to the $164 level. Volume pattern is showing aggressive accumulation during this period increasing the probably of a breakout soon without this pattern transforming into a cup and handle pattern (pull back before a breakout takes place).
A strong daily close above $164 would trigger a long entry with a possible price target of $230-$235 targeting prior ATHs.
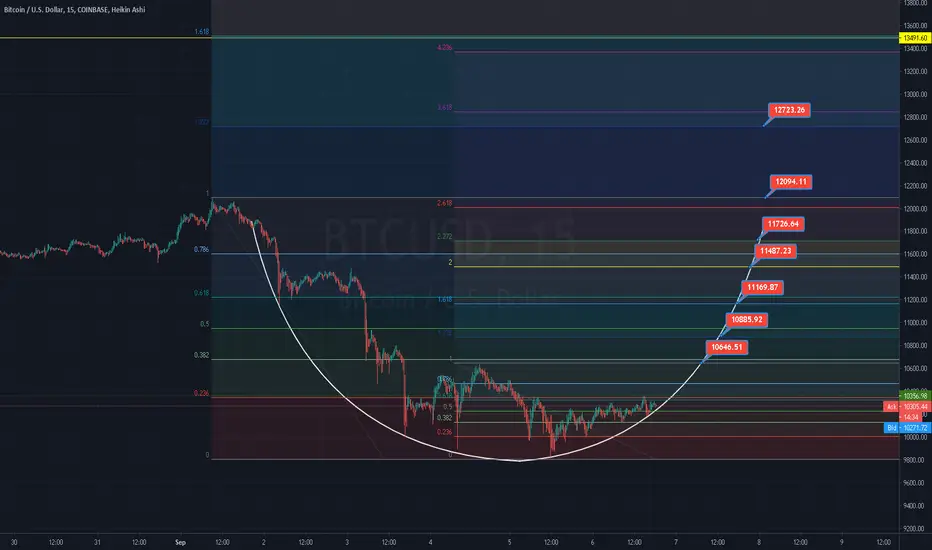
Better BTC bottom... experimenting.I have been playing around with rounding bottoms, and have been getting better at finding the actual trend/support.
Just another idea to watch play out.
Lets see how it goes!

BTC has a round bottom?I may have spotted a rounding bottom on the latest trend move for BTC.
Gimme that bottom!

$PFSI daIly chart bullish breakout$PFSI has just broken from a rounding formation
Neckline stands at 56 so it has to hold above that
MACD cross up on above 20MA VolAvg day
Potential target around 64
Good luck,
TA

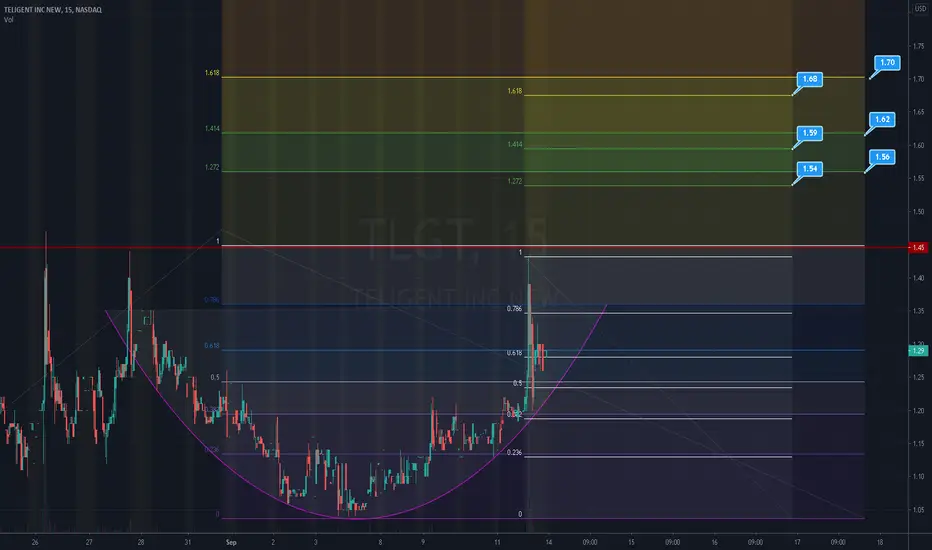
TLGT: Showing me its round bottom?TLGT on the 15 minute chart in order to watch it move.
I see a rounding bottom, but I swear I just see that everywhere nowadays.
The fibs, retracement as well as trend-based extension, show a range of PT's above 1.44.
Seems a good PT range is 1.54 -1.62 for lower end, and up to 1.70 for higher end.
Anything beyond those levels will require quite a bit of volume and buying pressure.
Let's see how this plays out!
FLDM: Am I just seeing rounding bottoms everywhere?FLDM hourly chart.
Just wanted to publish my chart before it gets cleared, lol.
I think I see a rounding bottom on this sucker.
Also potential gap above.
Blue lines are what I think are res points.
I have short term and long term fibs showing, hopefully charted properly.
The candlesticks are Heikin Ashi.
The candle filler-colors are representative of RSI.
Vertical Lines:
Yellow (pre-market start)
Green (market open)
Orange (power hour/market close/after hours start)
Red (after hours end)
RSI Colors from High to Low:
Bright Green
Green
Dark Green
Light Blue
Dark Blue
Yellow
Orange
Red
Dark Red

Long Astra Micra for minimum 10%Long set up in Astra Micra
Looking good rounding bottom breakout
Buy above 131
Target 150 levels
Stop loss on Closing basis 120
