Bitcoin | Multi-Month Rounding Bottom / Cup & Handle"Markets usually don't do what the majority of people expect to happen."
Since there are so many people that would like to buy a dip at or under 5k, we might just see an incredibly large, multi-month rounding bottom on BTC, potentially transforming into a Cup & Handle pattern.
If this were to happen, we can expect accumulation during the next months and a slow buildup of buying pressure, leading up to ATH prices in late 2019.
'Capitulation' might be the potential ETF rejection of CBOE VanEck / SolidX in the end of September this year.
Roundingbottom

Potential Rounding Bottom For BitcoinOverall this looks like a potential rounding bottom pattern. Price action has been beautiful lately compared to the last few months. Historically 6k has been a well defended area for Bitcoin. Take into consideration that we have also set the first higher low of the year. Alts also seem to have potentially bottomed out. Of course there is no way to tell if they have & they might still fall but it is nice to see them moving along with Bitcoin as opposed to July when alts too major hits while BTC ran. I'd love to hear your thoughts and opinions on if you think this is potentially the bottom.


BTC - Im expecting a strong rally is coming! SHORT SQUEEZEBTC - Accumulation on macro level looks good so far.
Current rounding bottom is looking very strong
Red lines are resistance points that i expect to be respected and stop a rally or give support once broken
DO NOT TRADE UNLESS YOU AGREE WITH MY TA, I'M NOT AN EXPECT AND THIS IS NOT FINANCIAL ADVICE!
MAKE SURE YOU HAVE GOOD RISK MANAGEMENT FOR A LONG TERM PROFIT!


[Red Apple] "Rounding Bottom(Cupandhandle)?"_ BTC/USD _ 18.08.04It's forming Triangle after breakout of Wedge.
Then, Let's start the analysis for BTC/USD chart.
If you are busy, you can just read below briefly
'1. Briefing '
'4. Etc.'
'5. Summary and Strategy'
before read, click '+Thumb up, +Follow' :-)
1. Briefing
# Breakout of Wedge but possibility of moving sideways for a while
# Possibility of Dead Cross bet. 20EMA and 100EMA on daily chart
# Rounding Bottom (cup and handle) ?
2. Daily Chart
1) Trend
Breakout up-trend line
2) Candle
Similar with Hammer but not enough (Candle's body is too big)
3) EMA
a. Candles keep staying under 20EMA(red) and 50EMA(purple)
b. 100EMA(orange) can be crossed over 20EMA soon.
4) Sum.
The candle was not enough to be recognized Hammer for 'Buy' and EMA also still shows signal for 'Sell'.
3. 4H Chart
1) Trend
being resisted by up-trend line
1) EMA
a. 100EMA can be crossed over 50EMA
2) Pattern
a. Breakout of Wedge
b. Triangle
3) Elliott Wave
a. 4th wave can fall down to highest point of 1 wave
b. possibility for correction wave abc or correction wave 1~5.
4) Fibonacci
still staying around 0.382
5) Sum.
At the moment, Bollinger Band is squeezing. it means the candle can be moved sideways for a while. I guess that BTC is standing at the turning point of up or down.
4. Etc.
If corrected wave is stopped here, there's possibility to be formed Rounding Bottom pattern (Cup and handle). Actually, this pattern need more time but this market move quite quickly. so, i thought this is possible.
If it goes up from now until neck-line, you can buy from red circle which penetrate neck-line.
This pattern is just for your reference. if it goes up later, i'll introduce it again.
5. Strategy and Summary
a. About previous Briefing : if you bought BTC when Wedge was broken, check triangle pattern. but there's possibility to be formed Box.
b. About this Briefing : Same as previous strategy because many resistances are up there. (2 up trend lines, 1 down trend line, EMA,,,). It's no late to buy after confirming penetration of resistances.
If you are aggressive trader, always set your stop-loss and keep it
Trade safely and make your standards
If you think my idea is helpful for you, Click '+Thumb up, +Follow'
Also, if found something special, i will comment in real time.


Is Bitcoin... forming a Rounding Bottom?Two scenarios:
1. Potential rounding bottom formation.
2. Down to 5500, then 5900, then 5150 bottom, then to the moon!
Let's remember not long ago when everyone said 6k Bitcoin, 6k Bitcoin!! And we got to 6500 before the rally up. Lots of people missed out on that initial rally.
Now a lot of people are saying 5k, 5k!! ... watch out for that.

Ambrosus In a Rouding Bottom Breakout Pattern.Hey, I am back with another trade Idea.
This time looking at Ambrosus that has seen stable growment over past days.
Ambrosus is a low market cap token sitting at rank 166 which means there is potential for a high % breakout.
Okay, taking look at the chart you can see that a rouding bottom from downtrend has formed.
Taking look at the Indicators.
MACD is giving strong signal to buy, RSI has bounced from support back to high bullish levels and Stoch is flying.
Hope I made your view on whats going on with Ambrosus somehow clearer.
If you like this TA let me know in the comments, Likes are aprreciated, Thanks !
If this gets a little bit of attention, I will update!

XVG 1HR CHARTKeep an eye on XVG for a small round up pattern.
I'm still bullish myself on Verge.
As shown we may see a retest of that price zone followed by a small rest
& then hopefully rallying up for some good gains still to come.
Happy Trading Ya'll

BQX is forming a rounding bottomIt looks like BQX is forming a rounding bottom with two possible trending scenarios.
L1 I believe is more aggressive and less likely however L2 seems more realistic. It looks like we are at the bottom of the curve and its a long term hold, possibly 3-4 weeks.
I am bullish with this coin because the RSI on 1 day is above 60 and the volume is also high, indicating positive uptrend.

Rounded bottom?WABIBTC 1D timeframe
I think that this is Rounded bottom pattern. If u measure in the middle from top to bottom u can use that as potential target, and target will be on the first line of fibb lvls (0.236) , around 15443.

I cannot believe my eyes. Is BTC really curving itself up? Hi everyone.
I usually do not use much any of time-frames above 4H or the more over day for charting. However I tried my best with weekly candles on the BTCUSD pair .. because we are inside this cycle already for quite some time and it is good to try to grab some perspective.
So I jumped in and I did my best. Now I am bit hesitant to believe what I do see .. I learned to be skeptical so far. However, is that just my eyes deceiving me? Or do you see it too?
Did my sub-conscience play a prank on me, so I just cherry picked things? (I really tried not to) I have hard time believing it, that there would be so many signs of already bottoming about now.
So not the one panic sell, meaning the "real" capitulation then. Instead we are having rounding bottom with several smaller panic sells turned in round bottom. (and after this usually sharp spikes up are starting period of ascending accumulation ... and then rally up)
Do I have your blessing with my observations?
I am especially weak with Ichimoku, even so, I tried, so please bear with me, and if possible, give me some of your perspective to my conclusions. I will appreciate that (I am still learning from all of you guys .. and yeah - from SnipersTube)
If I sum it up ... from the weekly perspective it does not even look, like we were in deep recession, in some crash (looking mainly on RSI, kijun) ... more likely, like in slow, yet volatile consolidation in the overally still bullish market.
And what more! It even seem that it to be over -now!
If it reminds of anything ..
it would not be the looong recession in 2014-2015
.. more like the one just right before it. the sharper recession in 2013 ... we could thing of it as of deep consolidation before catching second breath in absolutely huuuuge runnup in November 2013 (and than there was the real bubble and recession).
.. just have look what weekly RSI was in depths of the 2013 "crash" before the 2014 run-up. Just to let you know - I didn't know it either - back than RSI jumped back to growth after just reaching 46 ... only in the big crash in 2015 it bottomed down on 30. Now we have reached 43 and RSI is kind of satisfied :-D and going up :-).
Moreover, if history tends to repeat itself - why would we not make it two-step cycle like last time .. why to compare this correction to the 2014-2015 crash? Have we been through repeating the 2013 small crash yet? How come, we would go in the big crash then?
If it so, than rejoice - bull season is about to begin for real!
So catch their horns and don't let them run away from you, they will carry you up to McCaffees target (good for him) and to the moon >:-D !
$weet!

ETH Looks like a Round bottom to meAlright, first target hit! I started this post yesterday but accidentally posted the post in privately I'm still learning Trading View as a platform, but that is where I posted these price tagets before the short squeeze... a little bummed it didn't post publicly because I want to get my rep up to be able to comment. If you want to see my chart where I called it the link is here:
^^^This is a continuation of that chart^^^
Well, we hit the first target a little quicker than I thought we would haha look at where I but the box I wasn't expecting that glorious of a short squeeze like the one we had overnight. Because we hit that faster than expected I'm holding my position for the second target. I mean we blew through my first target so I'm looking to number two and honestly, I think the market has bottomed so I'll probably just HODL from here haha.
Well Like this if you like this, and comment if you have questions, I'm happy to answer them.
Remember this is for educational purposes and is strictly my educated opinion involving my own porfolio. Please do your own research before trading yourself.
Thank you all!

It's Bulltime for Bitcoin! Read here what's happeningHello and welcome to my Bitcoin Analysis!
The weekend is knocking at the door but before we let it in, we should take a look of the market behaviour in the world of Crypto.
As Bitcoin broke through the big resistance (white trendline) one week ago, it did not approach the trendline again but makes higher highs ever since. At the current moment I see a healthy market sentiment with new money coming in daily based on the information I get from coinmarketcap.com
The era of the bears seems to be over for now which means it’s bulltime!
1. Bitcoin is printing a rounding bottom at the moment. This is a common reversal pattern which is a relative of the C&H which is also a possible outcome. (White round line on the chart)
2. The next major resistance in my chart ist he former neckline of the H&S reversal which was penetrated but didn’t break through. We can expect heavy resistance at $11700.
3. Minor resistance areas are the EMA’s. We’re currently flirting with the 55 EMA (red line on my chart). The next stop is the 200 EMA (Turquoise line).
4. All in all the market looks healthier than a long time ago. We might even see a new ATH this year, when mainstream media starts reporting
Have a great weekend and a good time trading, guys!
Always take care of your money.
Best
M.S.

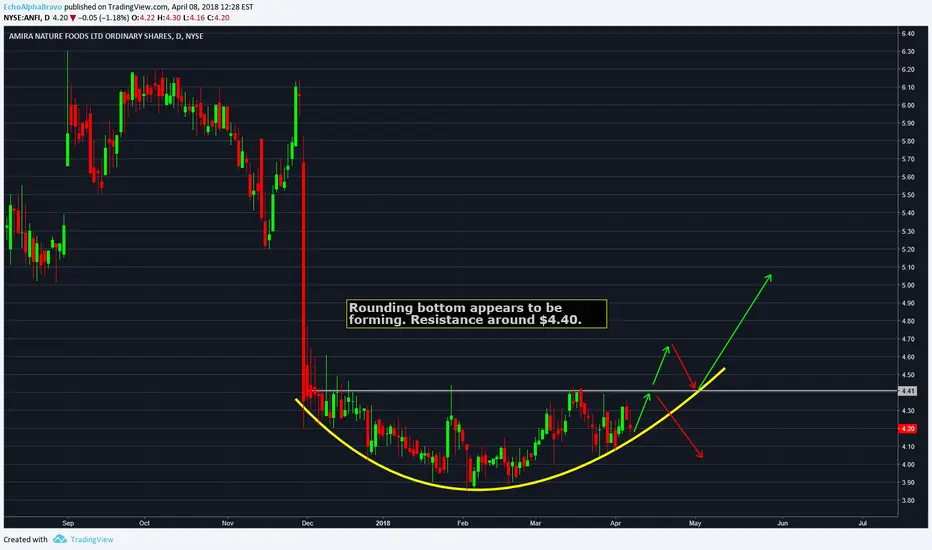
Picture perfect rounding bottomShares of ANFI appear to be forming a rounding bottom, with resistance overhead at $4.40. A breakout above could cause shares to rally, but a failure opens the door for a retest of the lows or extend lower.
To be fair, I don't know much about this company's fundamentals (yet), so I'll update this as I sift thru the financials. I just wanted to point out this damn-near perfect rounding bottom. If I end up positioning one way or the other, I'll update this idea. For now, I'm neutral.
Comments? Thoughts?
SingularDTV (SNGLS) Looks Ready to Pop!Hey, I am back with yet another chart.
This time I took look at SingularDTV - SNGLS. I was looking on Binance for a coin/token with low value, low market cap and approaching bottom with a some support.
SNGLS is a Token with a rank 196 in marketcap, which means, this coin can have strong breakout.
Also the USD price is really low, same as in May 2017.
Okay, but now straight to the point.
Chart.
From the beggining, SNGLS has been downtrending just as every other coin listed on binance, huge daily price movements. On 12 december SNGLS hit 690sat and found pretty strong support at that price. When SNGLS has shown that the price is holding at support (bottom) it had popped, right when BTC 1.17% was falling from 18,000$.
It was solid 450% breakout which is not that bad, or is it? The price have started dropping after the RSI falling to low 40 levels. Now we are at the "Bottom", which is great buying opportunity for SNGLS as we are on strong a support.
It looks like we can form Rounding Bottom or Cup and Handle , we have potential for 340%, but its not that likely, but still, these low value tokens are often pumped, take STORM as example. I wanted to buy STORM, as the price was few days on really low Values, but I wasnt sure because there were lack of graph info.
Mkay, the 3 Red lines represent ressitance lines.
Put sell right under those if you want to play safe, but keep in mind those crazy top candle wigs.
If the support wont hold, and daily candle closes under "Bottom", sell, I still feel like we can hit the bottom one more time before any major price movement upward.
Yes, so there are 2 ways.
A - break from the rounding bottom.
B - break from the cup and handle.
Indicators.
Bollinger Bands - Getting tighter, when the price is really stable as it is now, which means no crazy candles, that often lead to breakout, but not always.
Relative Strenght Index - We are aprroaching the good zone above 50, lets see if we can keep it up.
Commodity Channel Index - Good levels here as well.
Volume - for now, we have low Volume , but that can change in matter of hours.
Thats all I have to say for now.
If you agree or dissagree let me know, in comments down below.
Good luck trading!

Rounding BottomFTK Looks like a perfect rounding bottom, would have liked to have seen a little more volume accumulation coming near to the end of the pattern but nether the less it is a long period of consolidation looking to buy above yesterdays high targeting $8-10 initially

MOMO is making a reversalPotential Reversal in MOMO. .
+ EMA20 Crossed Above EMA50
+ Price stay above EMA20, RMA50 and EMA200
+ Price broke Downtrend Line and making Higher High
+ Price making Lower Low and tested Uptrend Line several times.
+ Nice Volume
+ Break Upper Bollinger Band
+ Strong +ve Force Index.
Expect to pull back a little to test EMA20 and make another Higher Low before continue to move uptrend to First Target of $39.
Next Target is to close the GAP down at $41
and Complete Rounding Bottom pattern at $46.
Conservative Trader : Put in watch-list. Partial Entry after pullback and new Higher Low form at around EMA20.
Aggressive Trader : Long with stop loss at previous Higher Low.

TLT - A Round Bottom make it a short term longLooks like TLT is forming a round bottom pattern.
I will be buying a couple calls with a march 16 expiration.
Target 121.
Have a nice trade!

XRP: Rounding BottomXRPBTC forming rounding bottom pattern on 30mins chart. information about rounding bottom can find out here www.investopedia.com .

QTUM in a good accumulation zoneQTUMUSD hourly chart shows the formation of a rounding bottom maintainng the general uptrend with higher lows. For investors like me seeking to add QTUM to the porrfolio long-term, I think this will be the best opportunity to get some.

SBUX making a comeback ? Spotted reversal in SBUX. It making higher high above EMA200. Would be nice if the price able to close higher in next few day
Looks like it is forming rounding bottom
