CanfinHomesCanfinhomes broke out of rounding bottom pattern with good volumes.
In terms of risk reward its an excellent trade.
Could be bought with mentioned stoploss & targets.
Roundingbottom

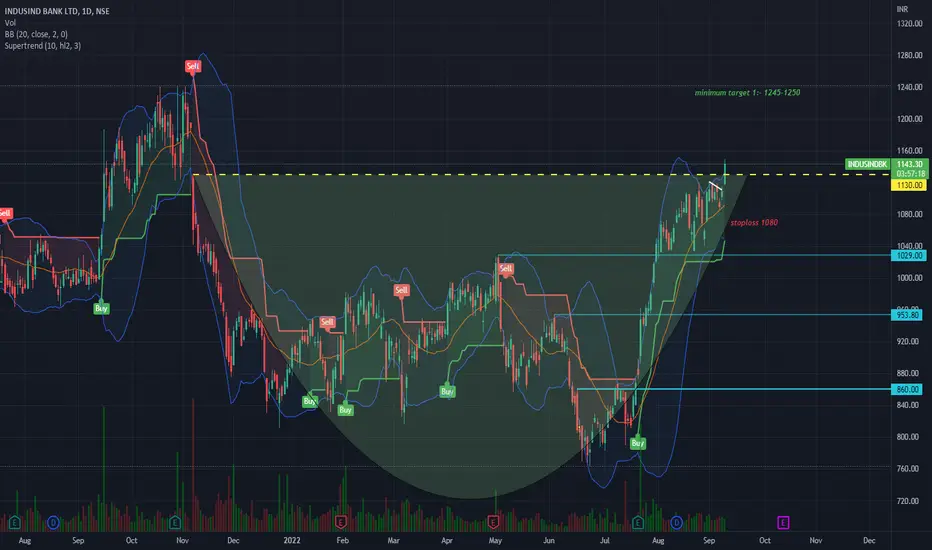
INDUSINDIndusind broke out of rounding bottom pattern with good volumes.
Could be bought with mentioned stoploss & targets.
BHARTIARTL Daily time Now Bharathi airtel forms a rounding top pattern with strong resistance level once broken we will look for a buy otherwise its in selling !

ZEEL 30 Mins Time FrameNow its forms big channel pattern with a round bottom pattern in ithe nside of the channel pattern takes trade only a successful breakout

PELPEL made rounding bottom formation on daily charts & it took more than 3 months to complete. Today it broke above neckline 2024 with good volumes it rejected before on 19th august. Today, its consistently trading above breakout level of 2024.
Could be bought with mentioned stoploss & targets.

Short-Term Bullish Rounding BottomWhat Is a Rounding Bottom?
A rounding bottom is a chart pattern used in technical analysis and is identified by a series of price movements that graphically form the shape of a "U". Rounding bottoms are found at the end of extended downward trends and signify a reversal in long-term price movements. This pattern's time frame can vary from several weeks to several months and is deemed by many traders as a rare occurrence. Ideally, volume and price will move in tandem, where volume confirms the price action.
-------------
NFA/DYOR.

RamcoCemRamco made rrounding bottom formation on hourly/daily charts & broke out of neckline with good volumes.
Could be bought with mentioned stoploss & targets.

GNFCGNFC made rounding bottom & breaking out of its monthly high with very good volumes.
Could be bought with mentioned stoploss & targets.

AxisbankAxisbank made rounding bottom on bigger time frames with good volumes.
Could be bought with mentioned stoploss & targets

Rounding Bottom pattern activatedHindzinc daily chart is being seen as rounding bottom pattern with volumes activities and
It is also fundamentally attractive valuation available with strong balance sheet. Quarterly results were also very strong posted by company.
Stop Loss : 255
Target : 307, 325, 385
Time Frame : 1 year
Investment as per your risk profile..
Risk is yours and Reward is too yours totally.

AxisbankAxisbank made rounding bottom on an hourly chart & its breaking out of it with decent volumes.
Could be bought with mentioned stoploss & targets.

6 month prediction on BTC bottom achieved #BITCOIN is at its bottom.
(Actually right now it's losing momentum)
I just wanted to post this quick message showing the chart.
You're going to want to ZOOM WAY OUT on the daily till you can see prior to December 2021 where I entered a short position.
Tomorrow afternoon I'm going to record a video discussing this move.
How I predicted it 6 months ago.
The formula for tge RSI that tells me the exit.
How fibbonacci was placed to confirm the move.
And the parts of my MASS EFFECT moving average that tell me:
A) The BTC downtrend is over.
B) What level did momentum get lost at
C) what is the zone it needs to cross going back up, before you should buy again.
If I were you, at this point, I would not short Bitcoin.
Share this idea. I'd really like to go LIVE and discuss with you guys who may have questions on the spot.


Rounding bottomBitcoin Dominance has formed a rounding bottom formation which is a bullish pattern how ever there are two things which needs to be consider here,
1. If this shoots up then alts and Bitcoin will fall.
2. We can see a relief rally if it goes down a bit and in this case we can see a pattern formation called CUP n handle which is also a bullish pattern.
So only time will tell what will happen, Hope for the best.

$ENS - ready for the breakout?the price formed a pattern we can identify as a cup&handle, or a rounding bottom, and if its resistance ( @ 20.5 ) is broken, we can expect a good rally to the upside
I'm looking for an entry above the monthly dynamic level @ 23.4 , if the price manages to close above that without an overbought RSI (>70) targeting at least a 12% profit - I'm going to post an idea about this if this scenario plays out
let me know what you think about this!

MULTI YEAR BREAKOUT, BIG TARGETNSE:ONMOBILE
Stock is consolidating below 160 from last 11 years.
if it breakout above 165 in WEEKLY TIMEFRAME ,
.
then ENTRY can be taken at 172 for a big target of 300 ,
CHART PATTERN - LONG CONSOLIDATION , ROUNDING BOTTOM , MULTI YEAR BREAKOUT
.
.
.
.
this is not a trading advice, only for an educational purpose.

Rounding Bottom Pattern foundAMBA Enterprises :
CMP: 28.95
Target : 40, 60, 90
SL: 18
Time Frame : Wealth Creation...
Risk is yours and Reward is too yours totally

Kotak BankKotak bank made rounding bottom & its trading above its last couple of weeks high with good volumes.
Could be bought with mentioned stoploss & targets.

TatamotorTatamotor made perfect rounding bottom on an hourly charts & trading above previous swing high.
Could be bought with mentioned stoploss & targets.

SCRT is on It's way to 10$SCRT (Secret Network) has been Listed in Kucoin Recently and it Has Created a Rounded Bottom Pattern. this pattern can Make The Price Increase to 10$ easily (if the Break out Happens! Right now). IF the Price Fails To break the Pattern and a Correction would Happen, We can Expect a Creation of Cup and Handle Pattern. In Both Cases We can Expect The 10$ achievement.
_ _ _ _ _ _ _ _ _ _ _ _ _ _ _ _ _ _ _ _ _ _ _ _ _ _ _ _ _ _ _ _ _
Thank you for seeing idea .
Have a nice day and Good luck

PENDING SLOW TURTLE BUY ON BREAKOUTMYX:LCTITAN
Pending slow turtle buy
big picture rounding bottom
target price at gap fill area

Breakout on Inflation expectationsThis week we have seen significant price increases in many soft and hard commodities. Is it any reason that inflation expectations have risen and broken their 2017 resistance.
