ETH - Oversold Zone!Hello TradingView Family / Fellow Traders. This is Richard, as known as theSignalyst.
ETH is overall bearish trading inside the brown channel and now approaching the lower trendline acting as non-horizontal support.
Moreover, the green area is a demand zone and round number 1000.0
So the highlighted purple circle is a very strong area to look for buy setups as it is the intersection of demand in green and the lower brown trendline, which I also consider an oversold area.
As per my trading style:
I will be waiting for it to approach the highlighted purple circle (area) to look for possible buy setups (like a double bottom, trendline break, and so on...)
If you like the idea, do not forget to support with a like and follow.
Always follow your trading plan regarding entry, risk management, and trade management.
Good luck!
All Strategies Are Good; If Managed Properly!
~Rich
Roundnumber

SOLANA close to support 💡📖Based on the chart after long time correction to the downside, the price has reacted to the support zone ✔️
and now
we can expect brief gain to the upside 🚀
and if
we lose the round number, here we will see more correction ❌🧨
Please, feel free to ask your question, write it in the comments below, and I will answer.🐋
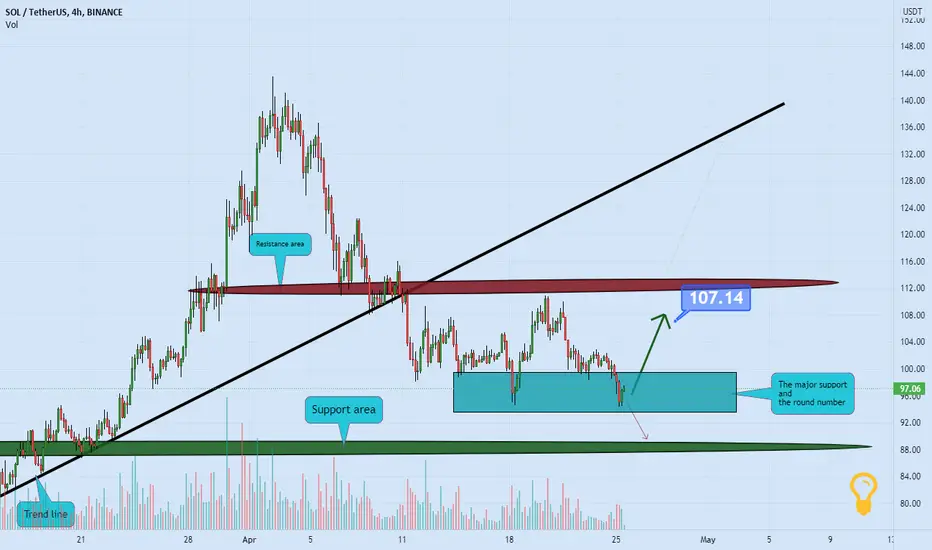
SOLONA the round number support 🚀Based on the chart, the price is close to vital support area and the round number $100 ✔️
if
the price stays above the trend line and support area, we will see more gain 🚀
if
we lose the support here, we can see brief correction ❌🧨
and
fundamentally and technically, we expect more gain for this brilliant token 📖🐋
Please, feel free to ask your question, write it in the comments below, and I will answer.🐋

DEEPAKNTR - Head and shoulder patternDetailed explanation provided on chart.
Disc - Am not a SEBI registered. Please do your own analyses before taking any position. This post is only for educational purpose and do not treat it as a trading recommendation.

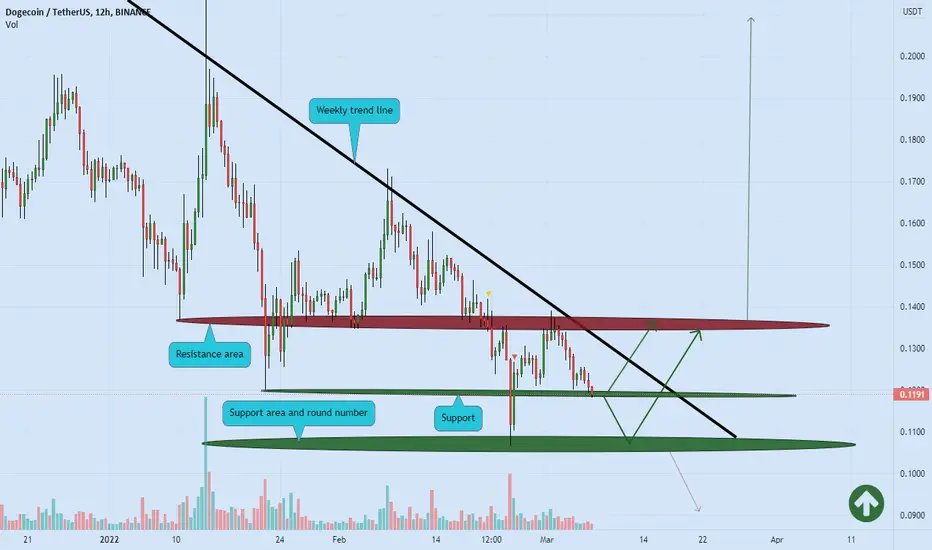
DOGE support zone 🚀Based on the chart, the price is close to round number (0.10) and two support area and one weekly trend line ✔️
we can see more gain from here or after brief correction from the round number 🚀
if the price breaks the weekly trend line to the upside, we can see more gain 🚀🚀
if the price breaks the round number, we will see more correction to the downside ❌🧨
Please, feel free to ask your question, write it in the comments below, and I will answer.🐋
BITCOIN round number and stop loss hunting 📚📖Today we are going through the brief technical explanation about the round numbers and stop loss hunting
round numbers:
the round number end in a zero, and have a tendency to attract orders and most of the time attracts many traders and they choose these points for entering and closing the position
Point:
For open position on round number the proper point for entering to trade is near the round number and not exactly on round number
For example:
For opening long position(buying) , your entry point should be above the round number and For opening short position(selling) your entry point should be below the round number.
Pay attention to the BITCOIN price near the round number 40000 :
If you want to open long position it's better to put your entry point above this round number but important point is that if this round number touches usually we have stop loss hunting and it is better to put your stop loss in proper place below the round numbers.
Stop loss hunting:
It is a strategy that makes market participants out of their position by driving the price to the area that many traders choose to set a stop loss there.
For example:
here on round number of 40000 we can expect that stop hunting happens and if someone wants to open long position on BITCOIN it is better to put stop loss below the round number with considering 3 percent penetration and if the price breaks this area the support becomes invalid.
🐳MAD WHALE🐋
This is not financial advice, always do your own research.
please, fell free to ask your question, write it in comments below and I will answer.
🐋


MKR - My Trading Plan in 5 mins!Hello everyone, sorry meant to say "MAKER" not "Mark Space" if you like the idea, do not forget to support with a like and follow.
Here is the top-down analysis for MKR, feel free to request any pair/instrument or ask any questions in the comment section below.
Best of luck!

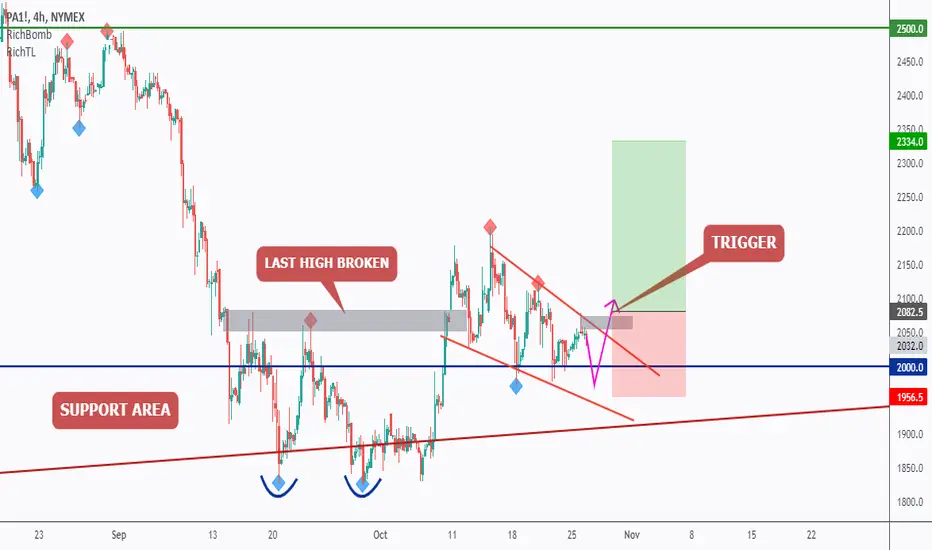
PALLADIUM - Potential Bullish Reversal!Hello TradingView Family, this is Richard, if you like the idea, do not forget to support with a like or/and comment.
PA1! is sitting around a strong support area and round number 2000.0 so we will be looking for buy setups on lower timeframes.
on H4: PA1! is forming a wedge pattern in red but the upper trendline is not valid yet, so we are waiting for a new swing high to form around it to consider it our trigger swing. (projection in purple)
Trigger => Waiting for that swing to form and then buy after a momentum candle close above it (gray zone)
Meanwhile, until the buy is activated , PA1! would be overall bearish can still trade lower.
Good luck!
All Strategies Are Good; If Managed Properly!
~Rich
CARDANO - My Trading Plan in 5 mins!Hello everyone, if you like the idea, do not forget to support with a like and follow.
Here is the top-down analysis for ADA, feel free to request any pair/instrument or ask any questions in the comment section below.
Best of luck!

ALGO - Potential Bullish Continuation!Hello everyone, if you like the idea, do not forget to support with a like and follow.
ALGO is trying to break the orange support/resistance again.
on H4: ALGO is forming a symmetrical triangle in blue but the upper trendline is not valid yet, so we are waiting for a new swing high to form around it to consider it our trigger swing. (projection in purple)
Trigger => Waiting for that swing to form and then buy after a momentum candle close above the gray zone.
Meanwhile, until the buy is activated, ALGO would be overall bearish can still trade lower.
Good luck!
All Strategies Are Good; If Managed Properly!
~Rich

IDEA - Potential Bullish Reversal!Hello everyone, if you like the idea, do not forget to support with a like and follow.
IDEA is approaching a support zone so we will be looking for buy setups on lower timeframes.
on H4: IDEA is forming a channel in blue but the upper trendline is not valid yet, so we are waiting for a new swing high to form around it to consider it our trigger swing. (projection in purple)
Trigger => Waiting for that swing to form and then buy after a momentum candle close above it (gray zone)
Meanwhile, until the buy is activated, IDEA would be overall bearish can still trade lower inside the channel and test 0.10 before going up.
Good luck!
All Strategies Are Good; If Managed Properly!
~Rich

FTM - Trend-Following Setup!Hello everyone, if you like the idea, do not forget to support with a like and follow.
FTM is overall bullish , broke above the 2.0 round number, and now retesting it, so we will be looking for buy setups on lower timeframes.
on H1: FTM is forming a channel in red but the upper trendline is not valid yet, so we are waiting for a new swing high to form around it to consider it our trigger swing. (projection in purple)
Trigger => Waiting for that swing to form and then buy after a momentum candle close above it (gray zone)
Meanwhile, until the buy is activated, FTM would be overall bearish can still trade lower.
Good luck!
All Strategies Are Good; If Managed Properly!
~Rich

ADA - Wait For The Trigger!Hello everyone, if you like the idea, do not forget to support with a like and follow.
ADA is sitting around the round number 2.0 in green so we will be looking for buy setups on lower timeframes.
on H4: ADA formed a valid trendline in red but the setup is not ready to go yet.
Before we buy, we want the bulls to prove that they are taking over.
Trigger => Waiting for a momentum candle close above the last high in gray to buy.
Meanwhile, until the buy is activated, ADA would be overall bearish can still trade lower and break below the 2.0 round number.
In this case, the bears would take over, we will be looking for new buy setups to form as it approaches the blue support zone around 1.50
Good luck!
All Strategies Are Good; If Managed Properly!
~Rich

CAKE - Who Wants A Piece? Video Analysis!Hello everyone, if you like the idea, do not forget to support with a like and follow.
Here is the top-down analysis for CAKE, feel free to request any pair/instrument or ask any questions in the comment section below.
Best of luck!

GBPUSD SELL SetupGBPUSD
Swing Trading SELL Setup for Next Week
Based on Psychological Level (Round Numbers), Support and Resistance, and Smart Money Concept


GBPJPY Intra-Day Buy SetupSETUP Based on Smart-Money Concept + Psychological (Round Numbers) Levels Strategy

GOLD, D1 - potential Butterfly patternAfter reaction on 78.6 retracement, possible move up towards 127.2 to form Butterfly harmonic pattern. Price broke important 1800 resistance level.

MY GU VIEWGoing short with a target of 1.36 level my stop will be at 50sl above my entry
dollar made a nice retrace back to 92.50 as expected on friday, we should see buying interest at this level

EURUSD H1 Chart Analysis & IdeaAs the EURUSD resets for the next trading week, price closes at 1.1795, inside a contraction level zone around 1.182/1.178, nearest demand zone around 1.172/1.168, nearest supply zone around 1.188/1.192, with weekly close reset trading range between 1.19 & 1.17, these are the areas of interest in this chart as of the week close. For price action, there's this wedge-like structure forming up on the hourly, and on the zoomed-out 4-hourly there's a established descending parallel channel getting escaped to the upside, maybe some more downside is possible, but only to grab liquidity further down and then move for higher prices, as this market finds a demand imbalance.

Uptrend is being brokenThere are indications (Tom Demark breakout projection and Yearly Pivot) that price will make to yearly S1.
Bears closed on the trendline, and stayed there, also closed below the round number. This indicates that breakout will continue.
1.11 might be the yearly bottom this year. Short term, I am looking for price to reach yearly pivot and the next round number level.

BTC first attempt to go below 30k... Today we witnessed the first attempt for BTC to go below, in humble opinion it is normal scenario and it should create fake signal for uptrend. I suspect that when BTC went below 30k it wiped out loads of stop losses which pushed price higher. 200 Ema should dump price in next weeks or days. Be aware that full moon is in next 4 days which is very important when dealing with financial markets. In short there is a higher activity with buying or selling during this period of time.
I think that if BTC will not go below 30k during full moon this could create very solid support to rely on for the next month or so.
to be clear here I am like 80% sure that BTC will go below 30k and will attempt to reach 20k but if it will not in the next weeks or days I would observe how the price will react to the upper resistance/support area of the channel.
