BATA INDIAHello and welcome to this analysis
Stock has made a bullish Harmonic Gartley and in this process has also made a double positive regular RSI divergence.
After such a sharp downfall stock has done a couple of candles in a consolidation zone and now could rally till 1600 with a smallish block near 1525, as long as it does not breach below 1380.
Good risk reward scenario at this juncture
Good luck with your investing
Rsi_divergence

Weekly RSI DIVERGENCE + TRIPLE BOTTOMWhat more can you ask? :)
* 𝗧𝗵𝗲 𝗶𝗻𝗳𝗼𝗿𝗺𝗮𝘁𝗶𝗼𝗻 𝗮𝗻𝗱 𝗮𝗻𝗮𝗹𝘆𝘀𝗶𝘀 𝘀𝗵𝗮𝗿𝗲𝗱 𝗶𝗻 𝘁𝗵𝗶𝘀 𝗽𝗼𝘀𝘁 𝗶𝘀 𝗻𝗼𝘁 𝗳𝗶𝗻𝗮𝗻𝗰𝗶𝗮𝗹 𝗮𝗱𝘃𝗶𝗰𝗲. 𝗔𝗹𝘄𝗮𝘆𝘀 𝗰𝗼𝗻𝗱𝘂𝗰𝘁 𝘆𝗼𝘂𝗿 𝗼𝘄𝗻 𝗮𝗻𝗮𝗹𝘆𝘀𝗶𝘀 𝗮𝗻𝗱 𝗿𝗲𝘀𝗲𝗮𝗿𝗰𝗵.

#ASIANPAINT Bullish Divergence!!!#Asianpaint:- There is bullish divergence between price & it's RSI. Price perfecttly following the upward trendline and again taken support at trendline & Moving toward upside. The price respected the support level and persisted itself at the support level . The market is pulling back after testing the resistance and impulse move. I expect growth from the support level. Above 2810 my target will be 2965-- 3020--3230.

TWT: UPDATE Currently, the market appears to be experiencing a decline, with many coins following the trend set by BTC. TWT has not yet received confirmation, but if it manages to rise above $1.46 in the next hours, it could potentially signal an upward trend that could be worth keeping an eye on. We will continue to monitor the situation to see if TWT is able to confirm this potential uptrend.
The first focus on this would be a 10% increase, from there we could see if this coin is able to confirm uptrends.
If this coin breakdown below $1.24 would be not more interesting for the low time frame.
Have good trades all.

"Swing Trading COIN: Bearish Divergence and Golden Pocket Setup"Confirm bearish divergence on RSI: Wait for a clear bearish divergence on the daily RSI chart for COIN .
Watch for a break below the 50 EMA: Keep an eye on the price action and volume to confirm a break below the 50 EMA. Volume increasing as it breaks 53.66 could signal a stronger bearish move.
Enter short position: Once the break below the 50 EMA is confirmed, consider entering a short position at a price level slightly below the 50 EMA. Set a stop-loss order at 58.10 to minimize losses if the price moves against the trade.
Set take-profit level: Set a take-profit level at 44.62, but consider taking into account the whole golden pocket between 52.78 and 43.78. The golden pocket is a Fibonacci retracement level and could act as a significant support level.
Monitor the trade: Monitor the trade closely and consider moving the stop-loss order to a trailing 5% once the trade is 15%+ in profit. This can help protect profits in case of sell exhaustion. Also, consider oversold levels as the price approaches the profit target.
Note: This trade setup strategy is based solely on technical analysis and does not take into account any fundamental factors that may affect the price of COIN. It is important to conduct further research and analysis before making any trading decisions, and to only risk an amount you are comfortable with losing.


RSI BULLISH DIVERGENCE Near SUPPORT !!!BIOCON Trading near strong monthly support zone of .. 223--- 210. There is bullish divergence also between PRICE & its RSI in weekly timeframe.
Price also taking support near demand zone.
#BIOCON📈📉
👉🏻Stock approaching strong Monthly & Weekly Demand Zone✅
👉🏻 223-10Support Zone 👍
👉🏻Stock Showing Strength from support📈📈
👉🏻 Good For Investment View📈📈
👉🏻RSI Bullish Divergence On Weekly chart✅
👉🏻TGT------ 243/258/280++ ✅
👉🏻Low Risk High Reward Setup🎯
👉🏻Add To Your Watchlist✅✅
Traders, if you liked this idea or if you have your own opinion about it, write in the comments. I will be glad.

Natural Gas prints an RSI bullish divergence As you can see in the chart, natural gas had a big downside movement for the last months. Now It looks like the bottom is printed so I will consider entering a long here with targets 3.11$ and 4.69$ .
You can see apart from the Bullish Divergence that It is starting to show a lot of strength, you can observe a gap-up between 2.314$ and 2.415$.
For the buy setup I will enter now and set an stop loss order under the gap. If the position goes well, I will keep locking profits manually trailing the stop under key areas.
Don't forget to share your thoughts on the comments and happy emotionless trading.

XAU/USD (GOLD) RECTANGLE TRADINGOANDA:XAUUSD
HI , TRADER'S .. AS you can see Market is in bearish trend since last 3 week's
AS RSI now reaching OVERSOLD region
BUYER'S CAN PUSH MARKET UP FROM HERE
Price is on major support of 1819
look for double bottom and take entry

What's next for CARDANO?Hello to all traders!
Today are we going to take a look at Cardano from a short/midt-term position. As we have seen, Cardano had a great start to the year with a 70% thus far. What naturally follows is a healthy correction. From what I can see, it's a lot of selling pressure at the 0,4-0,42 area making it a strong resistance line to break through as of right now. It has retested 0,4-0,41 multiple times but never enough to break through.
At this moment on the 1 hour timeframe we can see that it is on the 50 mark on the RSI, making it vulnerable to a lot of volatility. If it doesn't break past the 0,42 area, then we might have to look for a short position back down to 0,38-0,37.
If you look at the MACD indicator we can see that it doesn't look like it has enough volume or momentum to break through the specified areas mentioned earlier.
For a more short term strategy, we can see that on the 5 minute time frame that Cardano is looking strong, if it breaks past 0,4090 then I would begin to look for a long position with the first TP at around this month´s high at around 0,4180, and then shorting back down. At this moment Cardanois forming a descending channel pattern, that could very well be an indicator towards a short position.
I definitely think that Cardano is going to make some big legs these next weeks/months but not without some corrections along the way, as we can see from this month.
Enjoyed the analysis? Like! Want to see more? Follow!
Let me know what you guys think! Let me know in the comments!
- The Stallion
REMEMBER TO ALWAYS TRADE AT YOUR OWN RISK AND I AM NO FINANCIAL ADVISOR.

EURUSD: Strong Trendline and RSI Divergence Signal Upside PotentThe EURUSD has experienced a pullback in February due to concerns about inflation. This concern was further highlighted by yesterday's CPI (Consumer Price Index) data, which revealed that inflation may stick around longer than expected. The release of this data has led to a boost in the USD and a bearish outlook for the EURUSD.
However, despite the bearish price action, some traders are taking a contrarian view and looking for potential opportunities to buy into the pair. One factor supporting this view is the strong trendline that the EURUSD is currently approaching. This trendline has previously held, indicating potential support for the pair in the near term. If the trendline can hold, it may create a good entry point for traders looking to buy into the pair.
Additionally, a printed RSI divergence on the 4-hour chart is providing a reason for cautious optimism. RSI is a popular technical indicator used to identify potential areas of overbought or oversold conditions. When the RSI diverges from price, it can suggest that the current price movement is losing momentum, potentially leading to a reversal. This could be a sign that the bearish momentum for the EURUSD may be losing steam.
However, traders must also weigh the risks involved. These risks include ongoing concerns about inflation, geopolitical issues, and economic uncertainty caused by the COVID-19 pandemic. In particular, the CPI data released yesterday suggests that inflation may continue to be a concern for some time, which could create further pressure on the EURUSD.
In summary, while the current market sentiment for the EURUSD is bearish, some traders are taking a contrarian view and looking for potential opportunities to buy into the pair. The strong trendline and RSI divergence are providing reasons for cautious optimism. However, traders must also consider the risks and uncertainties in the market, particularly given the concerns about inflation and the broader economic outlook.

MANA/USDT Maybe some correction is needed.Hi Dears
Why MANA/USDT is going for correction?
In this idea, I would tell you the answer to this question in a brief and useful format.
First of all, we are moving near the weekly supply in the control zone.
Second, the volume is decreasing.
Third, the RSI shows clear Divergence.
And at last, the rising compression pattern is made.
So I think that correction is near.
You have to wait until the trigger is activated. Maybe the price wants to spike to the supply zone that is likely fake for gathering the liquidity and then starts to fall.
Sincerely
Hosein Poursaei

Bullish RSI divergence on Delta Corp ChartNSE:DELTACORP
As seen on the chart, DeltaCorp has shown bullish RSI divergence as the price went lower while RSI went higher. There is a very high probability that DeltaCorp could reverse from here and could reach at least 200
Disc - invested, for educational purposes only.

ETH Swing long trading setupHello guys
lets take a look at ETH/USDT Chart in Daily timeframe.
the price is struggling with 1260 level.
according to the temporary Bullish sentiment in market
i think price will surge to 1400 level.
where we have a strong Trendline and 61.8% Retracement Level of last price LEG
also a divergence seen between RSI and price recently that can improve this run.
at all i think price will reach a critical point drawn in my chart.
Dont Forget to set a suitable SL and manage your risk.
thank you for your attention
please share me your opinion in comments so i will be happy :)
GOOD LUCK

ADA USDT BINANCEADA following uptrend (white line) (Daily)
Bouncing off RSI Support.
Sell order @ .44 (resistance).
Looking for a bounce and continuation.
This isn't financial advice and you should always DYOR.
Thanks for following.
Like , Comment, and Follow for more ideas.

PLTR long position in daily chartPLTR take a long position in daily wedge pattern with reversal rsi trend
good luck

NUWE possible divergence with potential upside and targetsNASDAQ:NUWE Asking price now 7.54
potential upside with Fibonacci targets


Is IT stocks ready to lead the NIFTY?HCL TECH : CMP 1134
SUPPORT : 1010-1030
TGT : 1215/1305
IT index is going to support the NIFTY as most IT stocks is showing similar trends, Our pick is in this segment is HCLTech CMP 1134 has good support at 1010-1030 which is 50% retracement of recent high 1149 and about to breach the high and is heading towards 52wk high 1215 and if we consider Ellliotwave then it is continuation of wave 3 which will take it to 1305 which is our final TGT.

Gold up move has lost momentum - and looks correctiveSignificant loss of upside momentum on the daily RSI suggests that the gold market is vulnerable to a correction short term, you may wish to tighten up those stops.
The information posted on Trading View is for informative purposes and is not intended to constitute advice in any form, including but not limited to investment, accounting, tax, legal or regulatory advice. The information therefore has no regard to the specific investment objectives, financial situation or particular needs of any specific recipient. Opinions expressed are our current opinions as of the date appearing on Trading View only. All illustrations, forecasts or hypothetical data are for illustrative purposes only. The Society of Technical Analysts Ltd does not make representation that the information provided is appropriate for use in all jurisdictions or by all Investors or other potential Investors. Parties are therefore responsible for compliance with applicable local laws and regulations. The Society of Technical Analysts will not be held liable for any loss or damage resulting directly or indirectly from the use of any information on this site.

📉BTC Looking for a move up📈BINANCE:BTCUSDT
COINBASE:BTCUSD
Bitcoin analytical series S01E04!!!
Hello traders, Don't forget to risk-free your positions.
Please share ideas and leave a comment,
Let me know what's your idea.
CrazyS✌

Curious SymmetryNotice how similar the patterns highlighted. Diverging RSI with higher prices;
Exact RSI pattern as well. Could be setup for another drop, keep an eye out!

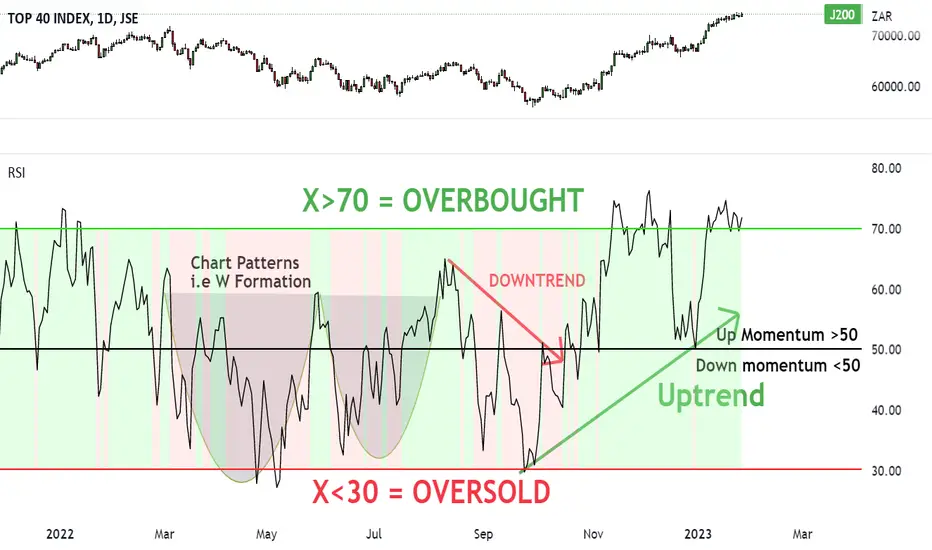
HOW IT WORKS: RSI (Relative Strength Index) IndicatorThe RSI is a popular momentum indicator used in technical analysis. It was originally developed by a mechanical engineer turned technical analyst J. Welles Wilder Jr.
It was first published in a 1978 book, “New Concepts in Technical Trading Systems” and in Commodities Magazine (Futures magazine) in June’s 1978 issue.
Today the RSI is one of the most popular indicators used to measure the speed and change of price movements.
In other words, it measures the strength of its trend direction (up, down and sideways) on any market by monitoring the changes in its closing price.
THE MAKE UP
The RSI is a line graph that moves between two extremes…
On the vertical axis (Y-Axis) the RSI line moves up and down in a range between 0 and 100.
NOTE: As the indicator is between a range, it is considered a closed indicator.
On the horizontal axis (X-Axis), the RSI line moves to the right which is plotted as time.
NOTE: You can choose your own time frame i.e. days, hours, minutes etc…
For all you technical boffins…
If you want to know how the RSI is calculated, I’ve saved this at the end of the article.
As a trader you won’t need to worry about the maths at all.
Three trading signals you’ll use with the RSI
1. Overbought and Oversold levels
2. Patterns and Trend lines
3. Bullish and Bearish Divergences
Trading signal 1:
Overbought and Oversold levels
When we see the market’s price move up, this means the buyers are outweighing the sellers.
And the more higher closing prices we see, on a market, the higher the RSI line moves…
When we see the market’s price drop, this means the sellers outweigh the buyers.
And the more lower closing prices we see, on a given market, the lower the RSI line moves…
However…
If the buying continues at an unsustainable rate, the RSI will reach a point that traders call OVERBOUGHT (top heavy).
This is where we could start to expect the price to drop from these levels and for the market to enter into a correction (dip).
If the selling volume continues at an unsustainable rate, the RSI will reach a point that traders call OVERSOLD (undervalued).
This is where we could start to expect the price to turn up from these levels and for the market to enter into a recovery (upside).
Now that you understand overbought and oversold terms, let’s explain what I mean with the RSI chart.
Overbought RSI: 70 (Sell opportunity)
When you see the RSI line touch or cross above 70 (Red horizontal line), this is considered an overbought situation.
At this point, traders may start to anticipate that the rising trend is about to end.
Traders may then start to prepare to sell and short their positions, as they believe the market’s price has run up too much.
If the market then turns down and starts to drop in price, the RSI line will drop below 70 and head back to equilibrium at 50 (Black horizontal line).
Oversold RSI: 30 (Buy opportunity)
When you see the RSI line touch or cross below 30 (Green horizontal line), this is considered an oversold situation.
At this point, traders may start to anticipate that the falling trend is about to end.
Traders may then start to buy (go long) their positions, as they believe the market’s price has dropped too much.
If the market then turns up from the 30 mark and starts to rise in price, the RSI line will move back to equilibrium at 50 (Black horizontal line).
Trading signal #2:
Trend lines & Patterns
The second way to spot buying and selling trade ideas is with trend lines and patterns.
Uptrend confirmation
To confirm the strength of the market’s uptrend, you should be able to draw a support (floor level) under the high low RSI prices.
And when the RSI breaks below the support line, it could signal the end of the uptrend and a start to the next bear market.
Downtrend confirmation
To confirm the strength of the market’s downtrend, you should be able to draw a resistance (ceiling level) over the lower RSI high prices.
And when the RSI breaks above the resistance line, it could signal the end of the downtrend and a start to the next bull market.
These are great confirmation and reversal trading signals to use with your strategy.
NOTE: You can also base your buy or sell ideas on trading chart patterns…
Trading signal #3:
Bullish & Bearish Divergence
The third signal I use to spot trade opportunities with the RSI is looking at the market’s price VERSUS the RSI’s direction.
In short…
BEARISH DIVERGENCE – Warning for downside
If the markets price makes higher lows, while the RSI makes lower highs – it’s a warning for DOWNSIDE to come.
BULLISH DIVERGENCE – Sign for upside
If the markets price makes lower highs, while the RSI makes higher lows – it’s a signal for UPSIDE to come.
Either way with both bullish and bearish divergences, the RSI fails to accept the current market’s price movements.
And so it is making a probability prediction that soon the market will make a reversal in its current trend.
Ok so now you know how the RSI works. Let’s sum up what we learnt.
RSI Summary in 3 Trading Signs:
Trading signal #1:
Overbought & Oversold levels
Overbought zone X > 70 = Selling opportunity
Neutral zone: X = 50
Oversold zone X < 30 = Buying opportunity
Trading signal #2:
Trend lines & Chart patterns
Uptrend confirmation: RSI makes higher lows (draw support line)
Downtrend confirmation: RSI makes lower highs (draw resistance line)
Breakout confirmation: RSI breaks out of a chart pattern
Trading signal #3:
Bullish & Bearish Divergence
Bullish divergence: Market’s price – lower highs
RSI – higher lows
Bearish divergence: Market’s price – higher lows
RSI – lower highs
Here’s how to calculate the RSI
The most common (default) settings for the RSI is 14 (Which we’ll use))
There is a two-part calculation with the RSI.
Part 1: Calculate the RSI (step 1)
RS or Relative Strength is (Average Gain ÷ Average Loss)
Average Gain = (Sum of gains over the past 14 periods) ÷ 14
Average Goss = (Sum of losses over the past 14 periods) ÷14
Calculate the RSI (Step 1)
Part 2: Calculate the RSI (Step 2)
Once you have this result, we then smoothen the RSI result with part 2…
And so that’s how the RSI continues with each closing price of the time frame you choose.
Trade well, live free.
Timon
(Financial trader since 2003)