Bullish
Closed at 34.03 (21-05-2025)
Hidden Bullish Divergence on bigger tf.
Bullish Divergence on shorter tf.
Immediate resistance is around 34 - 34.10
Crossing & Sustaining this level may exposes
upside towards 47 - 48
However, mid way, 40-41 & 44-45 are important
resistances that should not be ignored.
On the flip side, 30 - 32 are important Support levels.
and 29.80 Must not Break on Monthly Basis.
Rsi_divergence

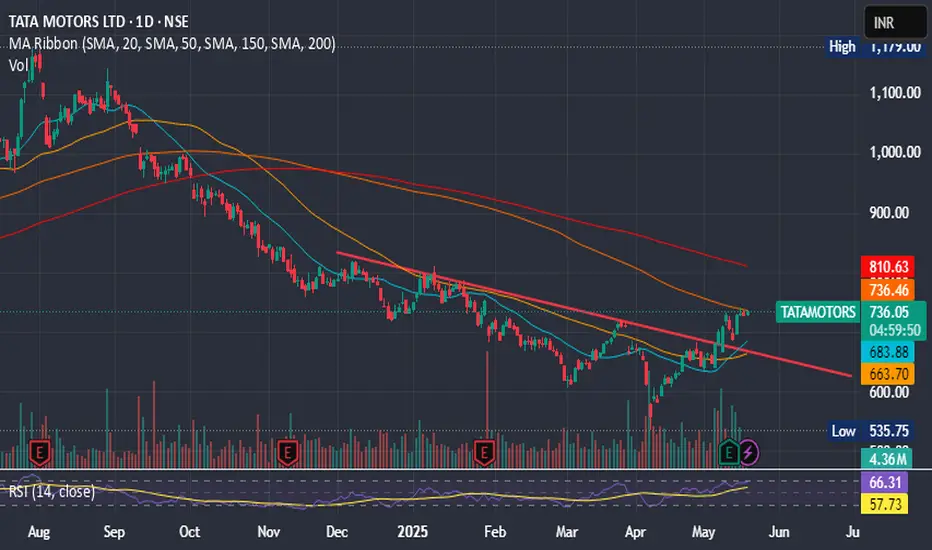
TATA MOTORS IGNITING MOMENTUM - Pivot Points: The classic pivot point is 731.45, with resistance levels at 733.4, 736.3, and 738.25, and support levels at 728.55, 726.6, and 723.7
Tata Motors' short-term trend appears bullish, with analysts predicting an upside target of ₹770–780 in the coming weeks. The stock has shown strong resilience near its support level of ₹715 and is trading above key short-term moving averages, signaling strength.
Key Levels:
- Support: 715–720
- Resistance: 735–740
- Target: 770–780 OR MORE TOWARDS 823
Hidden Bullish Divergence
Hidden Bullish Divergence is there.
Still have the potential; and may touch
17 & then around 21.
Trailing SL (at 13) is the Best Strategy for those who
are in this Trade as per our last analysis shared.


"Nifty 50 Eyes Breakout from Key Support Zone"**Support Zone (Red Rectangle)**:
* Strong support between ₹24,290 – ₹24,340.
* Multiple price bounces have occurred here, indicating demand presence.
**Resistance Levels**:
* **Immediate resistance**: ₹24,409.65 (horizontal red line)
* **Next resistance**: ₹24,494.45
**Support Levels**:
* **Immediate support**: ₹24,290
* **Next support**: ₹24,240.65
**RSI (Relative Strength Index) – 14 Period**
* RSI is at **36.25**, near the oversold region.
* Indicates the index may be poised for a short-term bounce.
* Positive RSI divergence is not yet confirmed but should be monitored.
---
**Bullish Scenario**:
* A breakout above the black descending trendline (\~₹24,360) with volume can lead to:
* First target: ₹24,409.65
* Second target: ₹24,494.45
* Supported by wedge breakout and RSI recovery.
**Bearish Scenario**:
* Breakdown below ₹24,290 zone can trigger a fall to:
* First target: ₹24,240.65
* Second target: Lower bound of ascending channel (\~₹24,060)

Fartcoin: Is the Smell of a Downtrend in the Air? 📉 Fartcoin: Is the Smell of a Downtrend in the Air? 💨
🚨 Alert: The RSI is holding its nose... and so should we.
After a suspiciously bubbly rally, $FARTCOIN is now showing bearish RSI divergence on the 4H chart — and let’s be honest, it’s starting to stink. 🦨
The recent price action looks like someone tried to pump it... but forgot to ventilate. 💣💨
🧻 Support is about to get wiped.
💩 MACD says momentum is going down the drain.
🚽 Volume drying up like gas after Taco Tuesday.
TA Summary:
RSI Divergence ✅
Rising wedge (aka clogged pipes) ✅
Community still in denial? ✅

Equity Research Update – Paras Defence and Space Technologies CMP: ₹1,143 | Upside Potential: High
Paras Defence has broken out of a strong resistance zone (~₹1,120–₹1,160), confirmed by significant volume and bullish momentum. The RSI shows strength above 70, indicating buyer dominance. Historical resistance, marked by previous rejections, may now act as strong support. If sustained, this breakout could lead to a fresh uptrend. Investors may consider accumulating on dips with a medium-term target of ₹1,300–₹1,350, keeping a stop-loss below ₹1,080.
Recommendation: BUY on Breakout Confirmation
For Education Purpose only

Weekly Support is around 80000.Weekly Support is around 80000.
However, 72500 - 73000 is its previous
breakout level & probably a Best Buying Rage
(if it touches) which is also a Confluence area of
Trendline Support+Important Fib. level.
Bullish Divergence on Shorter Time Frame +
Weekly Support around 80000 (if Sustained)
may push the Price up towards 87000 &
then around 95000 - 96000.
Ultimate Resistance is around 110000.
Crossing this level may open new Highs
Targeting around 136000.
On Shorter Timeframe, 85000 - 86000 is
the Immediate Resistance & Support is
around 80000.

Bitcoin Bear Rsi could be a leading indicator for months ahead. Base case is 120k then 4 year bear cycle down to sub 20k

RSI 101: Revealing the Special Characteristics of RSIWhy does RSI have support and resistance levels at 40 and 60?
Why does divergence happen between RSI and price?
What is RSI momentum?
All the characteristics of RSI (that I know) will be explained here.
Formula and Meaning
If you are using TradingView, you probably already know what RSI is and what "overbought" and "oversold" mean. So, I won’t repeat it here. Instead, I’ll dive deeper into the true nature of RSI, giving you a different perspective.
You can skip the mathematical formula of RSI, it’s already discussed everywhere online. Just remember this ratio table:
Here’s how I explain the table:
At RSI = 50, the average gain equals the average loss (I'll call this the buy/sell ratio). This is a balanced point. Buyers and sellers are equally strong.
At RSI ~ 60 (66.66), the buy/sell ratio = 2/1. Buyers are twice as strong as sellers.
At RSI ~ 40 (33.33), the buy/sell ratio = 1/2. Sellers are twice as strong as buyers.
At RSI = 80, the buy/sell ratio = 4/1. Buyers are four times stronger.
At RSI = 20, the buy/sell ratio = 1/4. Sellers are four times stronger.
The formula shows that when RSI reaches 80 or 20, the buyer or seller is extremely strong — about four times stronger — confirming a clear trend.
At these levels, some Trading strategies suggest placing a Sell or Buy based on the overbought/oversold idea.
But for me, that’s not the best way. The right approach is: when a trend is clearly formed, we should follow it.
I'll explain why right below.
Look at this chart showing RSI changes with the buy/sell ratio:
When RSI > 50:
When RSI < 50:
You can see that the higher RSI goes, the slower it climbs, but the high buy/sell ratio makes price move up faster.
Similarly, when RSI goes lower, it drops slower but price drops faster.
That’s why at overbought (RSI=80) or oversold (RSI=20) areas, you need to be careful. Even a small RSI moving can lead to big price changes, easily hitting your stop loss.
On the other hand, if you follow the trend and wait for RSI to pull back, you will trade safer and more profitably.
RSI Key Levels
Here are some special RSI levels I personally find useful when observing FX:XAUUSD :
(These levels are relative. They might vary with different timeframes or trading pairs. Check historical data to find the right ones for you. On bigger timeframes like M15 or above, the accuracy is better.)
RSI = 20
When RSI hits 20, sellers dominate. This confirms a trend reversal to bearish.
RSI = 80
When RSI hits 80, buyers dominate. This confirms a trend reversal to bullish.
RSI = 40
This is a sensitive level. Sellers start gaining the upper hand (sell/buy = 2/1).
If buyers lose 40, they lose their advantage.
So RSI >= 40 is "buyer territory". In an uptrend, RSI usually stays above 40.
RSI = 40 acts as support in an uptrend.
RSI = 60
Same idea. RSI <= 60 is "seller territory".
RSI = 60 acts as resistance in a downtrend.
40 and 60 are considered the key levels of RSI.
Now you guys know why RSI has support/resistance around 40/60!
RSI Range
As you know, RSI moves between 0 and 100.
Since RSI >= 40 is buyer territory, we can see the relationship between price and RSI:
When RSI stays above 40, price tends to move in an uptrend:
When RSI stays below 60, price tends to move in a downtrend:
When RSI stays between 40 and 60, buyers and sellers are balanced, and price moves sideways in a box:
When RSI is moving, It creates a RSI Range.
Whenever the trend switches between the three states — uptrend, sideways, and downtrend — a Range Shift is formed.
At first, RSI moves in 40-60 range, price moves sideways. A strong price move pushes RSI to 80. Later, RSI stays above 50, helping price grow strongly. When momentum fades, RSI returns to 40-60 and price moves sideways again.
Note:
RSI reflects Dow Theory by showing the stages of accumulation, growth, and distribution.
And as you see, when RSI touches key levels, the trend often pulls it back.
RSI Momentum
Price momentum means how fast price changes.RSI momentum represents the change in the strength between buying and selling forces.
When RSI > 50:
If price falls, RSI shows high momentum — RSI drops fast but price drops slowly.
If price rises, RSI shows low momentum — RSI rises slowly but price rises fast.
For example, at first RSI is above 50.
Price drops from (a) to (b) by 44 units, RSI drops from (Ra) to (Rb) by 25 units.
Later, RSI drops from (Rb) to (Rc) (also 25 units) but price drops from (b) to (c) by 73 units.
When RSI < 50:
If price falls, RSI has low momentum — RSI drops slowly but price falls fast.
If price rises, RSI has high momentum — RSI rises fast but price rises slowly.
RSI and Price Divergence
Divergence happens when price and RSI move in opposite directions:
Price goes up but RSI goes down, or vice versa.
Why does divergence happen?
In a strong downtrend, price forms a bottom at point (1), and RSI drops to level (r1).
When a price pullback happens, price pushes up to a peak at point (2), and RSI also bounces back to level (r2).
Because the downtrend is strong, after completing the pullback (1-2), price continues to make a lower bottom at point (3).
At this point, remember the behavior of RSI momentum when RSI is below 50:
It takes a large price drop (from 2 to 3) to cause a small RSI drop (from r2 to r3).
Meanwhile, even a small price increase (from 1 to 2) causes a large RSI rise (from r1 to r2).
Since the distance (1-2) is smaller than (2-3), but the RSI move (r1-r2) is bigger than (r2-r3), divergence is created.
Divergence shows that the current trend is very strong, not a complete signal of a trend reversal.
(I might share with you how to spot a complete RSI reversal signal in future posts.)
As shown in the example above, after forming bottom (5) and creating a bullish divergence between (3-5) and (r3-r5), price still kept dropping sharply while RSI kept rising.
In these areas, if you keep trying to catch a reversal just based on divergence, you will likely need to DCA or cut your losses many times.
That’s why the most important thing in trading is always to follow the trend.
RSI Exhaustion
RSI Exhaustion happens when RSI keeps getting rejected by a resistance or support zone and can’t break through.
After a strong downtrend, RSI recovers but stalls around the 5x zone.
It tries many times but fails, showing buying power is weakening.
Then the downtrend continues:
Exhaustion near high or low RSI levels creates stronger divergences than exhaustion in the middle range:
Double or triple tops/bottoms on RSI (M or W shapes) basically indicate RSI exhaustion.
RSI Can Identify Trend Strength
In an uptrend:
If RSI pulls back to a higher level before going up again, the trend is stronger.
The pullback should not fall too deep (below 40).
Example:
First rally: RSI drops to 60 before rising again → strong rally (273 units).
Second rally: RSI drops to 50 before rising again → weaker rally (94 units).
Same idea for a downtrend:
If RSI pullbacks to 50 then drops again, the downtrend is stronger than if it pullbacks to 60.
RSI Support and Resistance
Besides 40-60 acting as support/resistance, RSI also reacts to old tops and bottoms it created.
Why does this happen?
RSI is calculated from closing prices.
On a higher timeframe, the candle close price is a high/low or support/resistance price on lower timeframes.
When RSI moves in a trend on a higher timeframe, it maintains a buy/sell ratio, forcing lower timeframe RSI to oscillate within a range.
Example:
On H4, RSI stays above 40 → uptrend.
It makes H1 RSI move between 30-80.
Sharp RSI tops/bottoms react even stronger because they show strong buying/selling forces.
Summary
When looking at the price chart, we can see that price can rise or fall freely without any defined boundaries.
However, RSI operates differently: it always moves within a fixed range from 0 to 100.
During its movement, RSI forms specific patterns that reflect the behavior of price.
Because RSI has a clear boundary, identifying its characteristics and rules becomes easier compared to analyzing pure price action.
By studying RSI patterns, we can make better assumptions and predict future price trends with higher accuracy.
I have shared with you the core characteristics of RSI, summarized as follows:
Besides overbought (80) and oversold (20), RSI respects 40 and 60.
40 is support level in an uptrend. 60 is resistance level in a downtrend.
In an uptrend, RSI stays above 40.
In a downtrend, RSI stays below 60.
An RSI Range-Shift leads to a trend change.
RSI Divergence shows strong trends.
Double or triple tops/bottoms show RSI exhaustion → potential reversals.
The higher the RSI level, the slower it moves, but the faster the price rises.
The lower the RSI level, the slower it moves, but the faster the price falls.
A strong uptrend can be identified when RSI moves within a higher range or shows continuous bearish divergences.
A strong downtrend can be identified when RSI moves within a lower range or shows continuous bullish divergences.
RSI reacts to its old tops and bottoms.
Sharper RSI peaks show stronger selling.
Sharper RSI bottoms show stronger buying.
In the next parts, I’ll show you how to apply these RSI's Characteristics to trend analysis, multi-timeframe analysis, and trading strategies, that you might have never seen before.
I trade purely with RSI. Follow me for deep dives into RSI-based technical analysis and discussions!

Trading A Divergence Trade (Breakdown) with Pivots and LiquidityTrading divergences was always a problem for me in the past. I did the same thing you did and got it wrong every time. I was trading divergences when i saw them instead of realizing a divergence is a flip of support and resistance levels. I just needed to know where they are.
In this video:
Internal vs External Pivot divergence confirmation:
You can have two types of pivots on your chart. One for long term and one for short term.
Using them to confirm short and long term price action is intuitive as youll be able to see the market squeezing on the short term while knowing where your long term price structure exists.
Price action to Divergence Confirmation:
A divergence on a short term pivot is an indication of short term loss of trend or reversal.
If the short term has no divergence but the long term does, you are about to end up with some pretty large price moves.
Youll be confirming the divergence by looking for highs, lows, and closes moving the wrong way from current price action.
This video will give you a method you can use to draw out your support zone / resistance zone / divergence zone and use them to your advantage.
The "Divergence Zone" that you draw out is the very reason why so many people fail at divergences.
Bare in mind that when you have a divergence, support and resistance are on the WRONG sides as their normally are so you'll learn here how to find those zones as well.
Then in the end of the video ill show you how to use lower timeframes to confirm the new move of the market.
Thanks, everyone. For coming through to the CoffeeShop.

USDCHFRSI indicates Bullish Divergence. Which means that at any time the market trend can change to HH and HL.

Massive bullish divergence on BTCUSD 1D chartThe is a massive bullish divergence on the BTCUSD 1D chart.

GBPJPY TODAY FORECASTIn this forecast we're analyzing 2H time frame for GBPJPY. Today I'm looking for a potential buy trade setup. According to my analysis and strategy when price enters in my key levels as shown in the chart and give any bullish confirmation like candlestick pattern or price action. After taking confirmation we'll trigger our trade. Confirmation is most important part of this analysis.
Always use stoploss for your trade.
Always use proper money management and proper risk to reward ratio.
This is just my analysis. Further updates related this analysis will posted soon once price reach our levels.
#GBPJPY 2H Technical Analysis Expected Move.

#BTC/USD ANALYSIS. (BULLISH)Bitcoin Price Action Analysis. The Next Big Move?
Bitcoin is moving within an ascending channel, showing strong bullish momentum! However, a key decision point is approaching as the price nears a critical support zone (highlighted in blue). If BTC holds above this level, we could see a strong push towards the $91,500 resistance and potentially break into the $94,700 range.
A well structured risk-to-reward setup is in play, with a potential bullish breakout targeting new highs. Will BTC sustain its momentum, or will we see a retracement before the next leg up? Stay sharp and trade wisely! We will execute our trades only after receiving bullish confirmation.
Use proper stoploss and proper money management.
This is just my analysis. Observe the behavior of price how it will react.
#BTCUSD 2H Technical Analysis Expected Move.

RSI 101: Scalping Strategy with RSI DivergenceFX:XAUUSD
I'm an intraday trader, so I use the H1 timeframe to identify the main trend and the M5 timeframe for entry confirmation.
How to Determine the Trend
To determine the trend on a specific timeframe, I rely on one or more of the following factors:
1. Market Structure
We can determine the trend by analyzing price structure:
Uptrend: Identified when the market consistently forms higher highs and higher lows. This means price reaches new highs in successive cycles.
Downtrend: Identified when the market consistently forms lower highs and lower lows. Price gradually declines over time.
2. Moving Average
I typically use the EMA200 as the moving average to determine the trend. If price stays above the EMA200 and the EMA200 is sloping upwards, it's considered an uptrend. Conversely, if price is below the EMA200 and it’s sloping downwards, it signals a downtrend.
3. RSI
I'm almost use RSI in my trading system. RSI can also indicate the phase of the market:
If RSI in the 40–80 range, it's considered an uptrend.
If RSI in 20 -60 range, it's considered a downtrend.
In addition, the WMA45 of the RSI gives us additional trend confirmation:
Uptrend: WMA45 slopes upward or remains above the 50 level.
Downtrend: WMA45 slopes downward or stays below the 50 level.
Trading Strategy
With this RSI divergence trading strategy, we first identify the trend on the H1 timeframe:
Here, we can see that the H1 timeframe shows clear signs of a new uptrend:
Price is above the EMA200.
RSI is above 50.
WMA45 of RSI is sloping upward.
To confirm entries, move to the M5 timeframe and look for bullish RSI divergence, which aligns with the higher timeframe (H1) trend.
RSI Divergence, in case you're unfamiliar, happens when:
Price forms a higher high while RSI forms a lower high, or
Price forms a lower low while RSI forms a higher low.
RSI divergence is more reliable when the higher timeframe trend remains intact (as per the methods above), indicating that it’s only a pullback in the bigger trend, and we’re expecting the smaller timeframe to reverse back in line with the main trend.
Stop-loss:
Set your stop-loss 20–30 pips beyond the M5 swing high/low.
Or if H1 ends its uptrend and reverses.
Take-profit:
At a minimum 1R (risk:reward).
Or when M5 ends its trend.
You can take partial profits to optimize your gains:
Take partial profit at 1R.
Another part when M5 ends its trend.
The final part when H1 ends its trend.
My trading system is entirely based on RSI, feel free to follow me for technical analysis and discussions using RSI.

Class A/B RSI Bearish Divergence on SPY Futures?Really posting here to see if anyone would validate this for me but I was looking on the chart and this idea came about. On the weekly chart for ES1!, there seems to be class A or B Bearish Divergence developing on the Weekly timeframe.
Listen, of course we all know SPY trends upwards over time but is this an indicator of a larger sell the market needs to go higher every once in a blue moon? This is guarenteed a macro trend and I probably will have to wait a year for this analysis to play out but hey, at least we're here. (***ponders on how I charted Gamestop at $10 but never traded because of lack of knowledge***) Anyways, this is something I will of course monitor but let me highlight instances in history this has happened. Please feel free to give your input on this analysis!
Jan 1998 thru Apr 2001 (News Driver: Dot-Com Bubble)
Price makes higher highs from Jan 98' thru Mar 00'
From Mar 98' thru Mar 00', the 3 peaks formed on the RSI leading to price establishing a lower high (SMT) on Sep 00'. Fails to make new all-time high
From Sep 00' to Apr 01' price moves down as much as 30% over the next 224d
Jan 2013 thru Feb 2016
Price makes higher highs from Jan 13' thru May 15'
From May 13' thru Jun 14', the 3 peaks formed on the RSI leading to price establishing a lower high (SMT) Jul 15' and a following lower high on Nov 15'
From Jul 15' to Aug 15' (42d) (News Driver: Lagging China Market) price moves down as much as 14% and as much as 14% on the Nov '15 lower high to Jan 16' (78d) (News Driver: Oil Prices)
Current: Jan 24' thru Nov 24'
Price has been making higher highs all year
From Mar 24' thru , the RSI has been making lower highs while price is making higher highs
We are now at a point where price is pushing to go higher but what I would want to see based off of historical data is for price to consolidate or some type of Bearish Turtle Soup forming. If this happens and the RSI returns to Fair Value, we could be in for a sizeable sell of for at least a couple of weeks in the near future.
I will come back to this in the next few months. Happy Trading!

SUSHIUSDTRSI indicates Bullish Divergence. Which means that at any time the market trend can change to HH and HL.

GOLD - Day Trading with RSI 04/03/2025FX:XAUUSD
Daily Timeframe (D1): Still in a strong uptrend, with RSI and both moving averages are pointing upwards. The WMA45 is above 60.
4-Hour Timeframe (H4): RSI is positioned between the resistance created by WMA45 (current price around 3152) and the RSI 60 support level (current price around 3121).
1-Hour Timeframe (H1): The WMA45 is trending upward, supporting the bullish trend.
Trading Plan: BUY
Entry Zone:
When the RSI on the M15 timeframe is supported at the 50 or 60 levels.
Entry Confirmation:
When M5 completes a wave, or a divergence appears.
Or even when M1 shows divergence.
Stop Loss:
20–30 pips below the M5 low.
Take Profit:
100 pips or R:R ≥ 1:1.
Or when M5 completes its own uptrend.
But be careful when RSI on H4 reaches its own WMA45.
You can check out the indicators I use here: tradingview.com/u/dangtunglam14/

GOLD - Day Trading with RSI 04/02/2025
Weekly and Daily Timeframes (W & D):
GOLD is still in an uptrend, as the RSI's WMA45 is still hovering near the 70 level, and RSI remains above both of its moving averages.
H4 Timeframe:
This timeframe is currently showing a correction. However, it's not yet considered a downtrend because the WMA45 is still in the high region, close to the 70 level. But, RSI has dropped below the WMA45.
At present, the RSI on H4 is facing dynamic resistance from the WMA45 above and has support around the 4x level (43-48). The corresponding temporary price levels are approximately 3128 (resistance) and 3088 (support).
This end-of-uptrend correction on H4 could lead to high price volatility. GOLD may move within a 300–400 pip range (between the resistance from WMA45 and the RSI support around the 4x zone).
H1 Timeframe:
Currently in a downtrend, as RSI is moving below both of its MAs, and the WMA45 has a noticeable downward slope.
H1 also has RSI support at the 30 level (temporary price ~3086) and resistance at WMA45 above (temporary price ~3130).
Since we’re focusing on intraday trading, priority is given to the H1 trend.
Figure 1
Trading Plan: SELL
Entry Zone:
When RSI on M15 approaches upper resistance: levels 50–55 or 65–70.
Confirm Entry:
Conservative/Safe approach: when M5 ends its uptrend and reverses (see example in Figure 1 – M5 ends uptrend when RSI crosses below both MAs).
Or when bearish divergence appears on M5.
Or even earlier, when there’s divergence on M1 and M5's WMA45 flattens out.
Stoploss:
20–30 pips above M5’s recent peak.
Or if RSI on M5/M15 breaks through its previous high.
Take Profit:
100 pips or R:R >= 1:1.
Or when M5’s downtrend ends (when RSI crosses above both MAs).
You can check out the indicators I use here: www.tradingview.com

GOLD - Day Trading with RSI 04/01/2025FOREXCOM:XAUUSD
D and H4 Timeframes:
GOLD is in a strong uptrend.
RSI is operating around the 80 level, indicating that buying pressure is 4 times stronger than selling pressure.
Priority: Trade in the direction of the trend on higher timeframes.
H1 Timeframe:
GOLD is showing signs of a correction: EMA9 has crossed below WMA45, and RSI is positioned below the two MA lines.
Given the current slope of WMA45 on the H4 RSI, this correction is considered minor for now.
Intraday Trading Plan:
Entry Strategy:
If H1 continues to correct: Look for buy entries when RSI H1 reaches previous RSI lows (zones 44, 55).
If H1 breaks the current high (level 3128): Look for buy entries when RSI M15 reaches previous RSI lows (zones 30–40).
At these levels, RSI M5 should end its downward wave (e.g., forming a double-bottom pattern on RSI) or show a price-RSI divergence before entering a buy trade.
Stop Loss (SL):
Set SL 20–30 pips below the entry point's low on the M5 timeframe.
Take Profit (TP):
Follow an R:R ratio of at least 1:1.
Or, take profit when M5 ends its bullish wave:
If RSI M5 forms a double-top pattern or
If RSI M5 crosses below WMA45.
Partial profit-taking is recommended at different stages to optimize returns.
📌 Refer to my scripts for pre-configured RSI indicators. 🚀

Who knows ?SUZB3 is in an uptrend channel on the monthly chart, specifically at the lower edge of this channel, in a region that would indicate a buy, however, at this position on the 2-hour chart it presents a head and shoulders pattern at the end of a downtrend line. Meanwhile, the RSI shows divergence indicating a reversal to an uptrend.

Stock is Bullish but Currently moving in a Rectangular Channel.Stock is Bullish but Currently moving in a Rectangular
Channel.
Crossing 426 may lead it towards 450 &
Sustaining 450-455 may lead it towards 490 - 500.
However, breaking the Support of 360 will lead
it towards 290 - 300 where a Double bottom formation
can be seen.
