Is the NAS100 losing steam?Is the Nas100 losing steam on its downward momentum? The RSI has cooled down to previously seen levels, however the value is a lot higher.
This price action could signal a reversal point for tech stocks.
Rsi_divergence

GBPUSD | BuyEntry Parameter ;
1. ABCD pattern
2. S3 trendline
3. S2 horizontal (20 March 2020 Low)
4. Demand zone
5. RSI divergence
Setup ;
Buy = 1.14600
SL = 1.13600
TP1 = 1.18500
TP2 = 1.22750
RR1 = 1 : 3.9
RR2 = 1 : 8.15

HBAR is Ready For LONG PositionHBAR / USDT is Going to get a good setup for LONG POSITION
you can get this position with LEV10 X
Good Luck & dont forget to set SL & TP

IOTX is Ready For LONG PositionIOTX /USDT is Going to get a good setup for LONG POSITION
you can get this position with LEV10 X
Good Luck & dont forget to set SL & TP

BTCUSDT Bullish Divergence DangerZoneRsi 50 line can be a strong bear zone and a huge ristance so be carefull about it📊

USDCHF to sell soon?Using the three drives pattern, we can consider that the leg C has been reached (0.618 fib ratio of the entire pattern). This means that buyers are exhausted, reaching a great resistance zone for confluence on the D1.
Here we observe RSI bearish divergences on H4 and H1, with a double top pattern.
Wait for a big candle close below the neckline for more confirmation.
Good luck everyone,
Joe.

NZD/USD Next MoveTechnical Analysis Chart Update
NZD / USD ( New Zealand Dollar / U.S Dollar )
Time Frame - H1
FALLING WEDGE Pattern in Short Time Frame #STF and Rejection from the Lower Trend Line #LTL
Strong #SUPPORT Level
It is also Following #ELLIOT_WAVES in Short time Frame and it has completed the Impulsive waves will follow the Corrective Waves now
Strong Buying #Divergence in #RSI
DOUBLE BOTTOM Pattern in Long Time Frame #LTF

USDJPY Next Possible MoveTechnical Analysis Chart Update
USD / JPY ( U.S Dollar / Japanese Yen )
Time Frame - H1
RISING WEDGE Pattern in Short Time Frame #STF and Rejection from the Upper Trend Line #UTL
Strong Resistance Level
Strong Selling Divergence in #RSI

PEOPLEUSDT 1H analysis people in the last few days there has been a lot of fall and the divergence can be seen in the rsi . also in terms of the measured movements , it has reached the buying range .

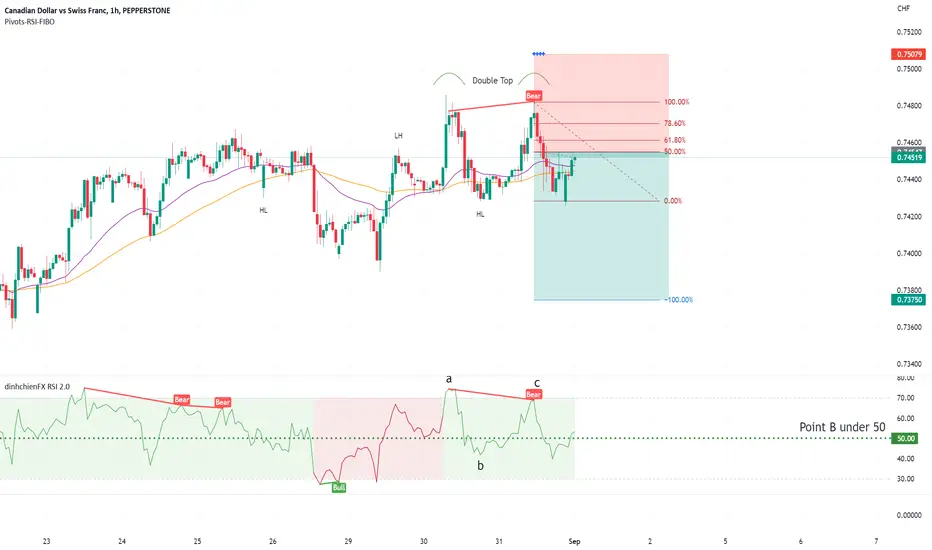
CADCHF - RSI Divergence & Double Top 9/1/20221. Real Divergence RSI:
- Point A is at overbought 70.
- Point B is the most important:
... Higher Low (HL) crosses under 2 EMAS: 34-89.
... RSI: B point crosses under 50.
- Point C: Higher High but not higher RSI overbought (70).
2. Double Top:
RSI divergence in EURUSD and USDJPY suggests DXY down, BTCUSD uphi there, fellows.
we've shown in previous idea the inverse relationship between DXY and BTCUSDT.
the main components of DXY are EUR and JPY.
we see an RSI bullish divergence in EURUSD, as well as an RSI bearish divergence on USDJPY.
that being true, DXY won't breakout the 109 resistance, thus now will BTCUSDT breakdown the 19k support meanwhile.
coupled with the greatest accumulation in BTC history, we expect an upward move in BTCUSDT in the short term, potentially within 21k2, 22k5 range.
that does not change the downtrend on BTCUSDT, nor the uptrend on DXY, rather we see it as a short term relieve.
best regards.

Double top on the dollar yen?The dollar yen seems to have reached the top of the bollinger band channel suggesting that the movement may be running out of momentum whilst topping out against a previous local high. The RSI yet again fails to put in new highs, are we about to catch the top?
We're looking forward to finding out.

NG shows weakness and lost momentum !!NG was very bullish at the start of 2022. This massive Uptrend stopped in June and led to a correction at the 0.618 Fib line.
After that, NG returns to the same old high, respecting the trend line and forming a significant Resistance.
the RSI is showing a considerable divergence as the second high lost momentum to continue pushing higher.
A break of the trend line in the next weeks will signal a huge short opportunity as the price may reach the 0.236 Fib line and if it breaks through the 0.382-Fib line as the second potential target.

XAU/USD Gold Next MoveXAU / USD ( Gold / U.S Dollar ) Technical Analysis Chart Update
Time Frame - H2
According to the Long Time Frame #LTL we have Falling Wedge Pattern and it has Rejected the Bearish Trend from the Lower Trend Line #LTL
If we look in Shorter Time Frame #STF we have 2 Strong Levels for Sell ( 1745 - 1753 ) if it rejects from these Levels then we can Enter in Sell
Another Thing we have is Strong Buying Divergence in #RSI
1753 is a good Level according to Daily Time Frame and Fibonacci Level - 78.60 as well

Why EURO will weaken early next week This pair is in an uptrend, so this trade is a counter trend. However there are some good reasons to take it.
1) There is a nice harmonic pattern in place.
2) All RSI are overbought
3) There is a nice divergence
4) The high of last week is also present.
We are already short on EURAUD. Similar setup for EURNZD.
Good luck!

Boliden: Time to short the Bear Bounce?Here, I am thinking that both Boliden and copper could potentially top out of their bear bounce. And possibly come back below the trendline.
There is a divergence between RSI and other indicators, which suggests that the 4-hour top is becoming more likely.
In addition, the current macroeconomic conditions are worse than usual, and generally speaking, September and October tend not to be optimal months.
MCX:COPPER1!

"N" pattern breakout with a good support in RSI Wonderla holiday can break a strong resistance zone after 4 year by giving breakout of N pattern with good rsi support which make its breakout more strong 💪 soo buy wonderla holidays at 375
Target 382 392 396 404 420
Sl 333
Must buy it !!
Have a profitable portfolio 😊
Wonderla was also a good stock for longterm for our side it has been soon touch the mark of 550-600 for longterm sl will be 259

Cardano Potential Triple Bottom Pattern at $0.40Cardano's (ADA) daily chart highlights the prospects of a potential triple bottom pattern at the $0.40 psychological number. Additionally, a confluence of technical factors supports the bullish case scenario, including the RSI hidden divergence and the 3-months descending triangle.
ADA Triple Bottom
The daily technical picture reveals that ADA has carved out a double bottom at the $0.40 level and is now eyeing a third to complete a triple bottom bullish reversal pattern. Usually, there is symmetry between the 3 consecutive valleys, which means that we can expect the next bottom to materialize 62 days after the second bottom.
This implies that the final bottom can emerge on September 13. While we can't develop an exact date for the bottom, this is a rough approximation.
Descending Triangle
At the same time, ADA is trading inside a descending triangle as each successive bounce from the $0.40 becomes smaller and smaller. As the price compresses inside the descending channel, we can expect the price ranges to shrink as well.
This ultimately will lead to a breakout as prices move from small price ranges to large price ranges.
RSI Hidden Divergence
The hidden bullish divergence develops when the price makes a higher low, while at the same time the RSI oscillator makes a lower low. This is often perceived as a bullish signal.
When we have multiple confluence technical factors lining up, the bullish case scenario becomes much more relevant, and there is a higher chance that the price will work in favor of these signals.

BTCUSDT Possible push till 26700$Hello Traders!!!!
As you can see in the chart Bitcoin is still holding an ascending Trend Line and the price did not managed to break the support of 20700$ in the last correction.
If you look at the RSI you can see a clear bullish divergence, which usually precedes ans strong movement to the upside.
Taking this in to account i think that the price can manage to hit 26700$ before falling more, this will be a pullback of the previous breakout to the downside of the support (now resistance)of 26.7k.
Regards and Happy Trading.

BAC expected to rise towards $37BAC stock price is trading at a major Fibonacci retracement level. Price is in bearish trend making lower lows and lower highs. There is no sign of a reversal yet. The RSI is not making lower lows, producing bullish divergence signals. I believe that the most probable scenario is for BAC stock price to form a bottom and signal a reversal to the upside soon, this expected reversal will eventually push price towards $37. I would certainly NOT be bearish BAC at current levels with current technical conditions. I would be looking entry points for long positions in order to trade the bounce.

Dollar Yen RSI and Stochastic RSI ratingTechnical analysis of movements of the USD/JPY on the daily and 4 hourly timeframes. BlackBull Markets analyses the RSI and Stochastic RSI, which are indicators that can show many features of chart movement.
Disclaimer: Trading is Risky. T&C's apply.
Education: All videos on this channel are provided for educational purposes only. The content contained in every video is generic in nature and does not represent a personal recommendation or investment advice. Black Bull Group Limited does not represent that any of the information provided is accurate, current, or complete and you should not rely upon it when making your trading or investment decisions.

Chance to sell AUDNZD based on technicalsThe pair has been on an uptrend since last week.
It is now OB on H4, H1, M30, M15.
The pair is showing divergence on H1, M30 and M15. There is also a pattern to sell at the high of last week.

BTC/USDT - 1H - Bullish ReversalBTC/USDT has been in a bearish trend. The price action has bounced off an important Support Zone that seems to have caused a bullish reversal.
The Bullish Bias is based on the following signals:
Price has stopped making LHs and LLs
Double bottom at support with neckline breakout
GMMA: Slow and Fast MA crossover
Falling Resistance breakout with bullish hammers
Bullish divergence on RSI + strength over 50 and not too near overbought levels
OBV convergence with price (uptrend has conviction)
Expecting bulls to be in control and take price towards the Resistance Zone .
