RSI Bullish divergenceShreerama Multi Tech formed bullish RSI divergence on the daily chart. Entry taking around 15-16 for target of 23/30.
Trading above 50 EMA
Rsi_divergence

Bitcoin is about to Bounce!Hey Traders,
On the four-hour, we can see the MACD is creeping up to a bullish histogram while the RSI is indicating strength is coming back into the market temporarily. If this happens we will definitely cross the four-hour ema orange basis line of the Bollinger Bands .
Safe Trading,
-Pulkanator


GDXJ Bull FlagGDXJ is showing some nice bullish divergence in the pennant of a bull flag on the 4hr and daily RSI. Upside is 30%+ and if it breaks down below the lows of the flag it'd be time to get out.
This is obviously dependent on what Gold spot price does. So, if XAU decides to finally use that hidden bullish divergence to head to all-time highs, then gold miners are gonna feast too. Playing the odds.

Hidden Positive Divergence Between Price and RSI on 1H TimeframeHidden Positive Divergence Between Price and RSI on 1H Timeframe

supply zonePrice at the supply zone
and in cp(feshordeghi)
----
Prices in supply areas and in cp (compression)
reaction to the trend line and the latest bull candle show market decision
RSI Divergence
DONT FORGET DOWN TREND!
-------------
I decided to put live chart tutorials and tips on my page so you can analyze the market accurately.
Join me to see the rest of the analysis in the future
--------------------------------------------------------------------------
If you have any questions, you can write it in comments below, and I will answer them.
And please don't forget to support this idea with your like and comment, thank you.

LONG #BAT $BAT // breakout + RSI divergence #basicattentiontokenim ready to long BAT as it formed a bullish rsi divergence on the daily timeframe in the past days and is now testing the 0.78 resistance: if we see a good 1D close above the 0.78 level we can set a nice long order targeting 0.94
stop loss would be around 0.71 for me
let me know what you think about this

EURUSD- DIVERGENCE IS getting strongerhello everyone
Bear flag of the may continues with a red candle on April, but we have divergence both on weekly and daily,
With the price this close to support level of 1.078$ we have a better chance of having a wedge behavior here( weak trend lines may not be in the favor wedge pattern).
resistance level 1.09$

Bullish Divergence in Euro FuturesBasically the same idea that I posted last week about the Bearish Divergence in $DXY but more time has passed, and it looks even more pronounced in the Euro itself.
Pick your poison: /6E, /M6E, EURUSD are all good Long candidates to play this idea. Another good option could be to short /SFX - which is the Small Exchange's US Dollar Futures contract. If you don't know about The Small Exchange, I'd highly recommend looking into their products.
community.thesmallexchange.com

usdt dominancedsdt dominance is near to old uptrend And in 4h timeframe we see divergence on rsi, We expect to be rejected from the 4.7 range and see a market recovery

GBPUSD RSI DivergenceGBPUSD has shown a bullish divergence and we are currently at an area of support meaning that a short term long is likely.
Remember to DYOR before investing and trading!

Litecoin Move Imminent...Hey Traders,
As you can see on the Daily Chart of Litecoin. The support/ resistance line has been very key in the past, but now it is acting as resistance again. The RSI is ramping up hinting a breakout! Hope you can trade this!
Safe Trading,
-Pulkanator

That is a strong trend line!!hello everyone
Last week candle was a big red one for almost 80% of cryptocurrencies, and for the last couple of days we saw the same behavior until 12th of Apr. Since then we have been moving in a channel in between resistance level of 18.30$ & support level of 17$( it was mostly the trend line).
For now we have divergence in RSI in 4 hours ,so the price may fail to break the resistance level and go back to our support level (or trend line) or worst ....

BTC Long-term buying tipJust reminding you that we are in the middle of an extremely important Range. Perhaps the strongest support of the last 2 years. Who wants a safe buy is right above the green arrows with stop below the fibo retracement lines at 0.382 and 0.5... This is what I will do for a long-term buy, in the most this region there is buy day trading and swing

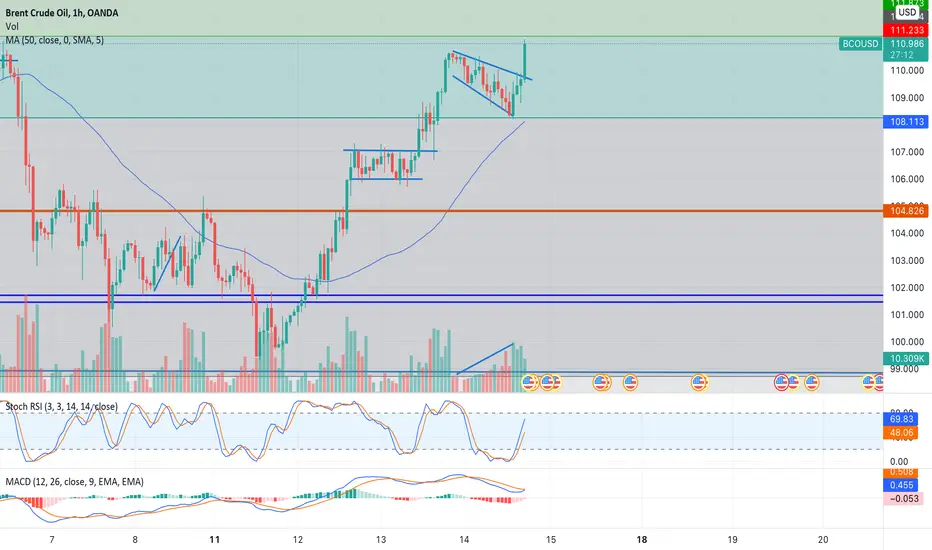
Descending Broadening WedgeBrent Crude Oil has fallen quite far from its yearly high of $135. That was almost two months ago. Ever since the price crashed down to $100 in less than two weeks from the high, the price has been swinging very nicely between Fibonacci levels. I had done some analysis of that in a previous post. However, today I will be analysing two chart patterns that have formed. The first that has already broken out is a flag. This is a specific chart pattern that forms after there has been a quick steep price rise (pole) and then a consolidation period (flag). The second is a descending broadening wedge.
Ideally from my learning, you want the flag patterns and any chart patterns to be on the daily timeframe. That is how I learnt it, I have had some success trading chart patterns on a short timeframe and I have largely seen other people do the same. However, I don’t know if this is just luck or actual trading. So, I will still use them just for educational purposes so that you may know what would be the case if it was on the daily or weekly frame.
The flag pattern has already broken out so there’s no point in analysing it apart from getting a price target:
Difference between bottom of pole ($99.938) to the top ($107.086) = $7.148 * 0.46 (percentage meeting price target) = $3.28
Add that to the bottom of the flag ($106.003) = $109.29.
The Flag pattern has already broken out and reached its price target. So the main focus will be the Descending Broadening Wedge.
Breakeven Failure Rate for upward breakouts: 18%
Average Rise: 32%
Throwback Rate: 62%
The bottom of the pattern has found support at the 0.62 Fibonacci level. The price, ideally, should touch (not cut) the trendlines five or more times. A good split between the two trendiness. That isn’t really the case here. However, the volume has been trending upwards. This is of course ideal. The price target for this pattern is quite simple for upward breakouts, it's just the peak. So that would be $110.632. This trade may be a quick one, however. The pattern has formed between two Fibonacci levels so the price may rebound once it hits the upper level. Also, as you can see from the Stochastic RSI (upper Indicator on the bottom) a bullish cross over has emerged. Also, the MACD (lower indicator on the bottom) could possibly be closing in on a bullish cross over.
Well, this is a bit embarrassing because by the time I finished my analysis the pattern broke out and reached its price target haha.
BTBT Long WeeklyNASDAQ:BTBT $BTBT on weekly looks bullish with RSI divergence, potential to reach Fibonacci targets after breaking the orange trend line
Asking price now $ 2.97

AUD/JPY
Hey guys, we have had one of the biggest rallies in AUD/JPY ever 11 weeks of green. It is in major overbought territory on the RSI on the weekly and negative divergence on the daily with a bearish consolidation pattern and possibly a breakout to the downside which might confirm today. IF it does confirm I will enter a short position target first red line then lower to burn these over bought signals out.
pre good risk to reward options

GBPUSD - Long - StrategyAccording to chart analysis, the RSI indicator shows bullish divergence, AB=CD Bullish Identified, Falling Wedge Reversal Pattern. Taking these points into consideration. Two Plans formed
Plan A:
Entry: 1.31723
TP: 1.33023
SL: 1.30437
Plan B:
Entry: 1.34103
TP: 1.36420
SL: 1.33023

RSI BEARISH DIV IDENTIFIED AFTER DECADE ON BTC MARKET CRASH 10KRSI Bearish on the market whilst there is a hidden bearish div as well on theweekly timeframe which may lead the market to crash till 10k

ADA/USD: Bullish movement to $1.13 USDCardano forming a bullish rising wedge that could to forming a bounce from this area. But I prefer to wait until Cardano make another buy confirmation using this EMAS to find up best buy when Cardano make this confirmation. But we would need to hope a pull back in the zone of $1.05 USD approximately to trade ADA in H1 timeframe. And also, as we forming a bullish divergence, this signal was confirmed and Cardano it's leading to the bounce right now.
Cardano forming a bullish divergene clearly in H4 tiemframe and this chartist pattern bullish rising wedge. But in fundamental theory this will be a bullish movement to the upside.
So guys, I hope that this idea support you to trade cryptocurrency, and also ,I will allow to trade in short term in H1 timeframe t find opportunities in crypto.

Bullish Divergence The Bitcoin price has created a lower low but the RSI hasn't followed hence creating a higher low which shows us there is a bullish divergence expected. Crossover on the MACD further confirms this momentum switch. I'd expect us to potentially push price back towards the $45300 level before we see any further price movement downwards. We also could break this resistance and confirm the bullish scenario again back towards $50k.

BBIG LONG WeeklyNASDAQ:BBIG
$BBIG on weekly looks bullish after breaking the short trend (orange line), last week retested the trend, RSI on weekly show divergence, potential Fibonacci goals are shown on the figure.
Asking price now @ $2.77

where shoud I Look for bearish Divergence ?! assending Channle in a down Trend trader shouldnt forget to compare between RSI of the whole channle and the RSI of the last main High.
best regards
