RSI divergence followed by a trendline breakAuropharama can be good shorting chance if it breaks the trendline with a good volume. keeping looking
Rsi_divergence

NEOUSDT & NEOBTC GANN Hello traders,,,
Today I will show you my idea about NEOBTC& NEOUSDT
NEOBTC is now having a Gann trend support and it is really important that NEOBTC stays above this resistance or we might go back to old prices, if new could stay above this support (2 daily close)
we might go to 0.000577 then 0.000599 and last target is 0.000682
If this scenario happened this will affect at NEOUSDT because if NEO get bullish versus BTC ,, NEOUSDT will go bullish too
so if NEOBTC go bullish our target at NEOUSDT 25.39 then 27.2 and our last target is 28.69 :)
NEOUSDT is now having a golden resistance (0.618) using fib extension if NEOUSDT could break this resistance with good volume we might see our targets
and now for RSI in both charts there is NO DIVERNGES that mean that our ascending channel is not strong enough to make the price go bearish BUT IT COULD HAPPEND IF WE NEO DOES NOT BREAK RESISCTANCE
Conclusion:
If NEOBTC get bullish NEOUSDT is likely to have the same.
This analysis has done by using Gann methods and Fib extension and RSI indicator & chart pattern
if you have any other opinion please feal free to share it in the comments below ,,,,,
Remember in this oscillatory market try to enter with volume
Have a nice day :))

3 indicators to eliminate false signals This is Matic/U.S Dollar and I'm using 3 indicators to help with eliminating false buy/sell signals.
1) MACD
2) RSI x 2 ( 25 & 100)
3) Supertrend
New to day trading crypto but these are super helpful indicators and you have to make sure the lines cross in the RSI and the MACD to have a good signal to buy or sell. In the MACD the blue line must cross the orange line to have a good signal.

#IPG Technical AnalysisAn example of a fractal pattern can be expected with RSI-price divergence. Follow the RSI for a breakout on the falling chart.

Hawks vs Doves, the battle of CNH…CNH1!
Birds of different feathers are likely not to flock together! As policy divergence continues between the US Fed (Hawkish) vs the PBoC (Dovish), we expect the Dollar to strengthen against the RMB on a macro level.
On the technical side, we see a bullish RSI divergence (prices making lower lows while RSI making higher lows), suggesting that momentum is nearing the end and potentially reversing. We also note proximity to the long-term support level since 2014 as an additional bullish factor.
Entry at 6.355, stop at 6.2955. Targets are 6.580 and 6.720.
Disclaimer:
The contents in this Idea are intended for information purpose only and do not constitute investment recommendation or advice. They serve as an integral part of a case study to demonstrate fundamental concepts in risk management under given market scenarios.

USDJPY looking bullish USDJPY after taking some correction still is in bullish channel and showing recovery in divergence

Daily Technical Analysis (Brent Oil)In the chart above, Brent Crude Oil has just broken downwards from the 0.38 Fibonacci level. The second red line from the top is another level of support that oil has broken out from. Also, the Stochastic RSI diverged (Top Blue Rectangle). Since these events have occurred, the price of oil has been decreasing.
If oil carries ongoing downwards to the 0.5 Fibonacci level then we could see some good level of support, Stochastic RSI has also just diverged (Bottom Blue Rectangle). So, following this, the yellow line shows my price prediction.
If oil carries on going down it could find some support at 0.5 and then rebound upwards. Then the price could find some resistance at the 0.38 level and if the buying power is strong enough the price could breakout upwards. If the buying power is not strong enough then oil could come back to the 0.5 level. Possibly even break through the 0.5 level, but that in opinion is not that likely.

Divergence RSI in BitcoinThe Bitcoin chart shows the RSI divergence in the weekly time frame. Which can be a sign of its bulish. In addition, the bitcoin chart is in support of the Tankensen and if it break the Ichimokue cloud and is supported by the Kijensen, it will probably climb higher.

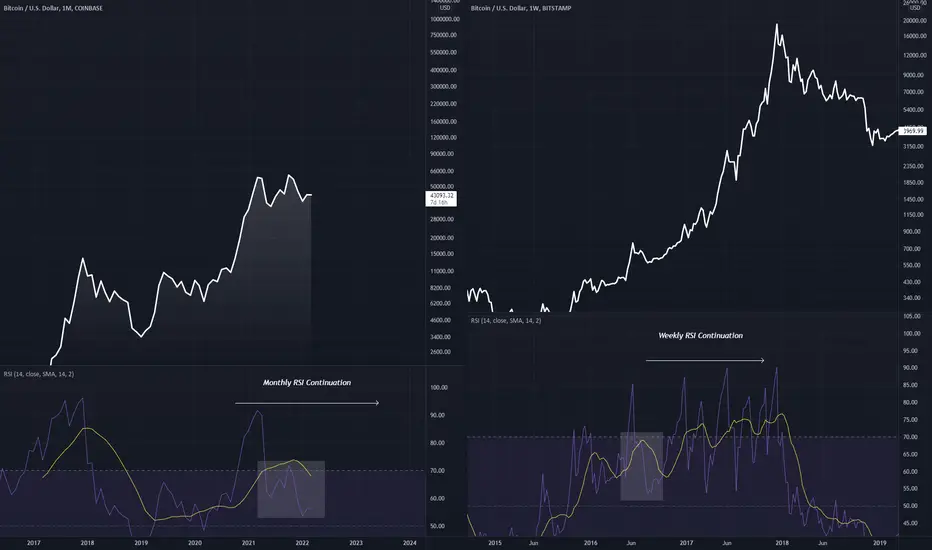
Viewing BTCUSD from a Completely Bullish PerspectiveComparing RSI charts you can see the Monthly RSI readying itself to continue in the fashion it did when BTC went parabolic in 2017
This RSI is correlated to BTC's overall parabolic nature
What i am saying is that from a monthly perspective, a bear market has never been experienced
Shiba Inu Smart Money Divergence Calls for a Potential BottomShiba Inu (SHIB) suffered a deep correction of about 80% from its all-time high of $0.00008864. However, recent price action development signals a potential bottom and a trend reversal. Often, major swings (highs or lows) can emerge when an asset is diverging from a benchmark index that tracks the market's overall performance – in technical terms, this is called relative strength.
Relative Strength Signal
If we compare SHIB's price against the altcoin index ALTPERP, which tracks the altcoin average market performance, we can observe that Shiba Inu shows relative strength. To measure the relative strength, we can compare the highs and lows of the two assets.
On the one hand, SHIB's price has printed a higher low, which shows a shift in the price structure while, at the same time, the altcoin index printed a lower low.
This tells us that Shiba Inu is outperforming its peers within the altcoin market.
We can't currently call a bottom based on the relative strength signal alone because the current bounce lacks momentum. However, if we study the RSI oscillator, we can tell that most RSI readings are below the 50 mid-level, so the bearish momentum still persists.
For a reversal to happen, two major things need to happen:
1. The RSI needs to break above the 50 mid-level
2. SHIB's price needs to break above its 200-day simple moving average
Looking forward: The first major resistance level comes around the $0.00002662 level. On the flip side, the support level comes at the big round number of $0.00002000.

BTC 29k - 30k Support Now is 36k - 37k!That 36k -37k Range proves to be as strong as 29k - 30k and maybe it's this support that has gone up.
For the medium term we had a very strong breakout of the 39600 - 40k resistance where a good entry now would be after the bullish pivot forms with a retest in this region.
- A conservative entry would be on the breakout of the previous candlestick's high on the retest.
- Resistance at 42900 and fibo targets on the chart.
- Heikin Ashi showed buying strength in several h4 candles from March 6th to today. We also had the escalation of bullish divergences smaller tfs up to h3 on the RSI with the confirmation made by MACD crossover.
As I like to emphasize, monthly we are in a bull channel.
Portugues...
Esse Range de 36k -37k se mostra tão forte quanto 29k - 30k e talvez seja esse suporte que tenha subido.
Para médio prazo tivemos um rompimento com muita força da resistência de 39600 - 40k onde uma boa entrada agora seria após o pivô de alta se formar com um reteste nessa região.
- Uma entrada conservadora seria no rompimento da máxima do candle anterior no reteste.
- Resistencia em 42900 e alvos de fibo no gráfico.
- Heikin Ashi mostrou a força compradora em vários candles de h4 des do dia 6 de março até hoje. Tivemos tb a escalada de divergências bullish tfs menores até h3 no RSI com a confirmação feita por MACD crossover.
Como gosto de frisar, mensal estamos num canal de alta.

The Bullish way to look the Qs...This would the bullish way to look at the Qs, if the 100week moving average, where we are currently is considered value by the market and we really turn around here.
Double bottom at the .786 from the low exatly 1 year ago to the All time highs with classic triple bullish divergence in both the MACD and RSI
It doesn't get much better than this tbh, if we just had a somewhat "normal" makro invironment.... Almost trade setup worthy

NASDAQ HAS CHANCES TO UP MORE-next updateHello my friends, today I want to talk with you about nq
I think price can start to grow to our target
So be ready for such scenario.
This is an article, not financial advice, always do your own research.
If you have any questions, you can write it in comments below, and I will answer them.
And please don't forget to support this idea with your like and comment, thank you.

Strong buy in CAMSThere is strong rsi diversion in CAMS, the price was trading lower low but rsi is trading in higher low so, your first target will be yellow line which will give you a gain of 8% and if the price break yellow line with strong volume then your second Target will be at orange line which is again give you extra 8% gain.
And don't forget to keep trailing your stoploss !
First Target - Yellow line
Second Target - Orange line
Stoploss - Swing Low .

BTC Weekly Timeframe Analysis Chart
- BTC on the weekly timeframe. Weekly is not the strongest macro timeframe. Sometimes proves false signals.
Dragonfly / Gravestone Doji
- Highlighted in the green are the dragon fly doji's (recent signal doesn't close until Sunday)
- Highlighted in the red are the gravestone doji's
- Arguably the strongest significant Japanese Candle Stick for trend reversals.
Link: www.fxdayjob.com
RSI:
- Decreasing RSI + Increase in Price = Hidden Bullish Divergence
- Increasing RSI + Decrease in Price = Hidden Bearish Divergence
- Note that in summer of 2021 we had the same confluence in the chart.
MacD:
- Classic bullish divergence on the weekly.
- Note that bigger timeframes (Monthly, 2 week) are bearish.
Moving Averages:
- 50 Day $47,000
- 200 Day $20,000
Analysis:
- This is a high-risk trade b/c of current events.
- Fed is set to have a meeting regarding equities in March. (Likely to be very negative)
- I predict a further continuation rally here. May not bring us to ATH but, a recovery rally.
- Most importantly, do your own research. Strive to be a better trader every day.

XAUUSD - Bearish Reversal to AT LEAST $1878.00 (21/02/2022)OANDA:XAUUSD Hi I can sense a bearish reversal for XAUUSD.
I have used smart money concepts (SMC) as well as retail trading logic into this trade.
LOOK AT THE CHART FOR THE AMOUNT OF CONFLUENCES I HAVE FOR THIS REVERSAL.
There are so many confluences in this trade that I cant be bothered to list them all here, so study my chart and learn.
Have a good trading week! More analysis to come :)
RISK DISCLAIMER: DO NOT TRADE THIS! I AM NOT A FINANCIAL ADVISER. THIS TRADE COULD POSSIBLY FAIL. YOU HAVE BEEN WARNED.


Exit ADA LossBINANCE:ADAUSDT
Hello dear friends
I hope you have made the least loss in these red and unknown days of the market.
Many people have bought the ADA in the range of $ 2 or higher, which today is priced in the range of $ 1.
What to do??
In my opinion, ADA has made a good price correction compared to other cryptocurrencies and can return with a small correction. Friends who are at a loss can buy one step at $ 1 and the second step at 0.8.
But for friends who want to get into ADA, there are two good entry points:
1: After breaking the downtrend line and pullback to it means stabilizing above $ 1.35 First goal: $ 1.9
B: At the $ 0.8 support point, the first target: $ 1, the second target: $ 1.4 and the third target: $ 1.9
Positive point: ADA in daily time frame is a very strong positive divergence in RSI.
Negative point: BTC in a time frame of a month has a very strong negative divergence in RSI that can affect the whole market.
Be profitable
We are waiting for your questions :)

XAUUSD (GOLD) Daily ForecastTechnical:
The near–term support is around $1780, violation below targets $1770/$1750. Significant reversal only below $1750.The yellow metal facing strong resistance of $1810, any violation above will take to the next level $1835/$1860/$1877$1912 is possible.
DISCLAIMER: ((trade based on your own decision ))
<>

SP500 historic crash?The SP500 doesn't look good. Many things are going on here:
1. The weekly candle closed below the resistance
2. Bearish divergence in short and long term with the RSI
3. It appears to be forming a HS pattern in the weekly timeframe. We will know for sure in a few weeks.
4. On top of that the FED announced the end of money "printing" by March.
5. Only the big cap stocks kept the SP500 going up. On the other hand there is bloodbath going on from months ago on growing stocks. Is just about days for the big cap stocks to join the bloody party.

Luna obligatoriness breakoutFormation of Falling wedge and ascending triangle on luna 4h chart. Volume decreasing and regular bullish divergence on RSI. A breakout is required for one side, which will be?. Waiting ...

Ethereum Bearish Divergence on WeeklyWatch for trend reversal in the weekly charts as it could signal a sharp drop in price.

Bitcoin Bearish RSI Divergence on WeeklyThis past year we have seen higher highs and higher lows in price action paired with lower highs and lower lows in the RSI 14. Watch for a trend reversal on the weekly in the coming months, as it could signal a sharp drop in price.
