$SHOM Could be a runnerSlightly oversold on the hourly so id expect a slight pullback. Buy the retrace and enjoy the ride
Rsi_divergence

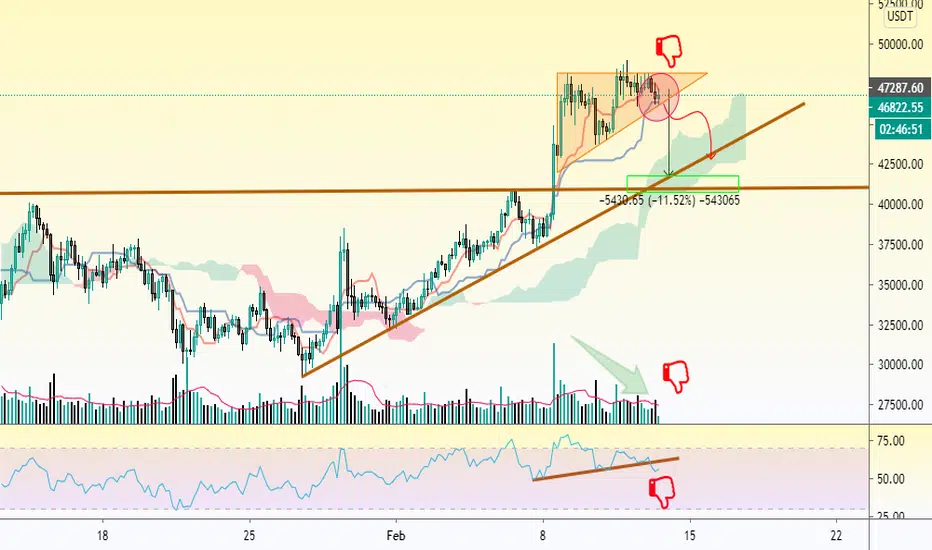
Bullish divergence on BTCHello
I have spotted a bullish divergence on BTC on RSII hope you like it, Overall I think there is a big chance that the current bull trend is over.
always use stop losses.
This is not financial advice.

Bullish DivergenceBTC has been going down for a while now. It currently hit the 50K support level and bounced a bit back. However, this was a lower-low for BTC and the RSI indicator shows a higher low. If BTC closes the next 4H candle above the yellow horizontal dashed-line, then I will enter a long trade. If not, then I would wait for other opportunities. This is not a piece of financial advice, trade at your own risk.

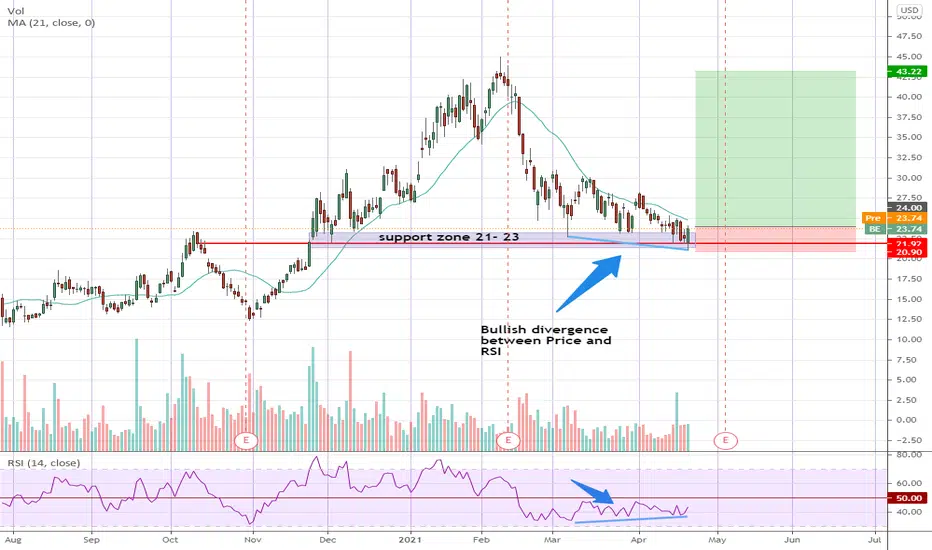
BE - Getting near to a pop soon?BE has been in a frustrating slow grind generally downwards for the past 6 weeks while a Bullish Divergence between Price and RSI has been slowly building.
It tested a possible strong support at 21.90 yesterday and quickly rebounded to close a rather strong candle.
The odds are getting better that the worst could be over. However we might not see real momentum yet until the RSI rises above 50.
Disclaimer: This is just my own analysis and opinion for discussion and is not a trade advice. Kindly do your own due diligence and trade according to your own risk tolerance. Thank you. Feel free to give me your thoughts ! :)
PetronetIt has formed a Bullish Harmonic AB=CD in daily time frame along with double RSI bullish divergence. It could retrace till 235-240 as long as its above 218.

Brief Bear Before Next ATHClear Bear Signal on 14 Apr, engulfing candle in NQ ate up every penny earned on 13th, a twin tower. Volume declining, RSI Overbought.
Bull trend is intact, IMO gonna retest the breakout point and consolidate bullish power before moving to ATH in late April > early May.
A real correction to emerge later in May > June; then a summer rally. ERs will drive it now, SandP PE = 42, need big ERs to support price.
Not investing advice, trade at your own risk, GLTA!

🥶 0.25 looking like next target 🎯 3D chart looking so bullish after breaking the ATH.
Long term HODL. Tell me what you think?
I’m not a financial advisor.

$OPEN false breakdown, time to long?Opendoor Technologies Inc, one of ARKW's holding, had a false breakdown yesterday(4/12) and it seems to be wanting to retest some resistances.
Pros:
- RSI Bullish divergence on the 4hr chart.
- Seems to have found support with 5 EMA
- Price is close to the bottom of the BB, making it a good R/R trade
Cons:
- Volume has been decreasing, 4/12 breakout had a massive volume compared to the average. (Could be a false breakout to trigger stop-losses which are likely set on (3/31) low
- The stock follows ARK's trend, if ARK's ETFs underperform, it is unlikely that $OPEN will do well.
Critical levels:
Supports: 19 / 20.33 (5EMA)
Resistances: 21 / 22.95 (20MA) / 26.34 (50 EMA)
My position: Entry 21.02 / PT 28.5 / SL 19. Return so far -6.38%

DXY to Continue Showing Strength as it heads towards 95We got in at the bottom and will continue to show conviction as the DXY attempts to back test the old 91-92 resistance zone as support. If successful the DXY should have clearance to rise to 94 and beyond.
As of now the DXY is showing 3 layers of hidden bullish divergence on the MACD and 2 on the RSI while forming what looks to be a broadening channel above the 92 resistance area.
I expect that this uptrend for the DXY will continue as the US Dollar continues to gain strength and overblown fears of inflation become shattered.

ETH - Ascending Wedge Watching this ascending wedge on the ETH 4 hour. After a very bullish few days, the move looks to be coming to and end in the short term. The technical pattern combined with declining volume and bearish divergence are all forecasting a move to the downside. Don't be afraid to take some alt season profits to have some dry powder.

GBPCHF> Trading Plan for A Short !!I hope you are feeling generous and loving today to give me a like and leave a comment it will really support the creation of new free ideas for you.
Analysis up on #GBPCHF
Hello friends.
If you have been watching the market closely, you would have noticed there are many markets with RSI divergence and it is been going on for a while now and this might continue this way.
However, we can watch this market for a break of structure in anticipation of a change in trend.
If the Market breaks the recent structure level I will look to get in a valid short trade that meets my rules, in total this possible setup could bring over 400 pips for two TPS
Safe trading everyone
Check today analysis below⠀
>> you must know what is your risk before you get in a trade, many traders will only look at how much they will get
_____________________________________________________________________________⠀
-Disclaimer: This information is not a recommendation to BUY or SELL. It is to be used for educational purposes only⠀
-Please note this is just a PREDICTION and I have no reason to act on it and neither should you

GBPNZD > Possible Reversal Setup For A Short !!I hope you are feeling generous and loving today to give me a like and leave a comment it will really support the creation of new free ideas for you.
Analysis up on #GBPNZD
Hello friends.
a double top with RSI divergence near-weekly resistance at 1.9800 number good setup for a reversal trade, waiting for a confirmation to get in the trade targeting structure support level
Safe trading everyone
Check today analysis below⠀
>> you must know what is your risk before you get in a trade, many traders will only look at how much they will get
_____________________________________________________________________________⠀
-Disclaimer: This information is not a recommendation to BUY or SELL. It is to be used for educational purposes only⠀
-Please note this is just a PREDICTION and I have no reason to act on it and neither should you

Long NiftyLong nifty if it sustain above 14925 or getting a breakout of inverted head and shoulders in RSI as same as in nifty, target should be above 15200 and 15250 with a minimal stop of below the previous candles close and could be below to the previous low,
When to trade?
1. Open above 14900 and sustain
2. Breakout in a RSI of the drawn trend line
3. Breakout of previous candles high (H1, H2, H3)


SPY - looking wobbly The SPY daily is beginning to look a bit scary. Massive bearish divergence on the RSI and negative fundamental news with the Archegos default. Will be looking for downside in the short to medium term down to the anchored vwap from November 9th with has proven to me massive support. Breaking that will likely lead to much more pain on the downside.

Storj LONG position FULL RSI divergenceRSI Divergence
Long position to the moon
Good Fundamentaly COIN

ETHBTC RSI situationA H&S has formed on the RSI
Similar price action can be drawn from the right and left shoulder
I bounce off indicator is a possibility

Time for the Bitcoin to consolidate/correct?There is a divergence between RSI and Bitcoin price. In addition to that, Bitcoin price is breaking the trend line that has been guiding the price upwards since the beginning of the year. It seems that is time to digest gains for the next weeks ahead.
Consolidation can only take two directions: sideways or down.
The next important resistance could be 43k.
What is it going to do? No one knows, only time will tell.
Have fun and be careful out there!

ES1 H&S In Progress? Bearish Momentum PlayChart shows it. RSI, MFI in DT. Short the rallies IMO. Overlay from October.
Not investing advice, trade at ur own risk, GLTA!

Descending movement on AUD/NZDDescending movement within the ascending wedge is so possible. RSI movement can confirm it that price movement is going to be descended.

CELO/USDT - Long potential due to trend reversalCELO/USDT pair has formed a double bottom on the 1H timeframe.
Even though the pattern might not look reliable at first, a key thing to note is the RSI divergence
While the price has formed a lower low, the RSI has moved upwards. This indicates that the bulls are gaining momentum
The price has broken the neckline so the pattern looks successful. The ATR value is low which indicates that volatility is going to increase
Look to time your entry around support using RSI for momentum based swing trades

BTCUSDT needs a correction? Short on bitcoin?! Everything is saying YES, probably it's time to see a deep correction!
GA Short IdeaShort idea with multiple confluences. 30 minute is starting to make ists finally push into the entry while RSI should start to diverge. Great 1:11 R trade
