DIS swing long - confluence galore(4hr) strong bullish rsi divergence off demand zone, golden pocket retrace
(4hr ext off/1D) - 200MA support
Rsi_divergence

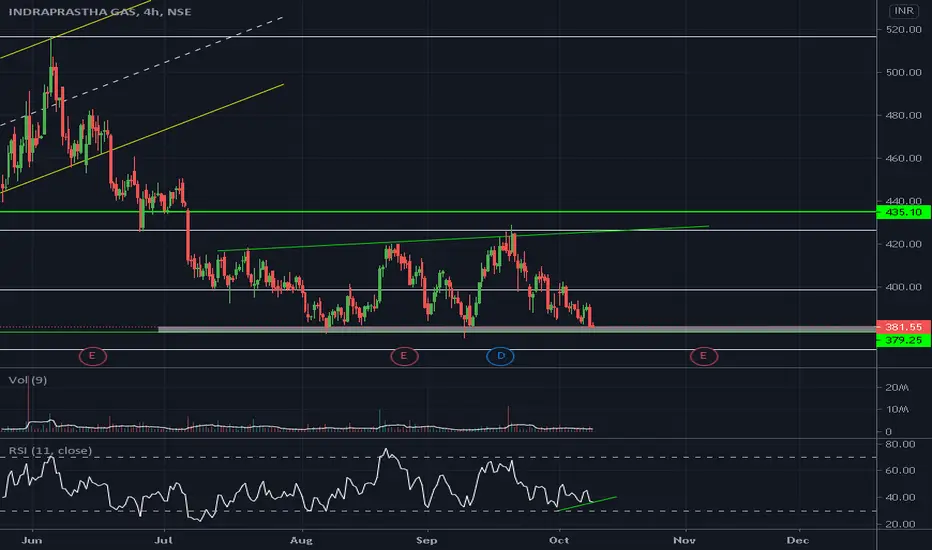
Indraprasta Gas 425 TargetObservations :
1. Expanding channel pattern
2. Current price at support of 379 to 381 level
3. More than 50% retrenchment
4. RSI Divergence
Entry 393
Stop loss 378
Exit 425
Risk Reward Ratio: 2.28

ZM w/ some Bearish Divergence, a Descending Triangle, & SMA TestI'm not an expert by any means, but unless some news comes out supporting the prolonging of "lockdown" or "quarantine" (promoting Working from Home for longer), I see ZM taking a solid dip, if not a dive if a daily candle closes below the 10-SMA. I'm seeing this idea supported in the RSI Bearish Divergence, Descending Triangle forming, and even the MACD indicating a change in momentum with not only the Crossover, but also an inflection point in the signal line beginning to slope downwards rather than upwards.
Again, all it takes is some Breaking News or a NASDAQ rebound to cancel all of this out. But if that doesn't happen early next week, this is what I'm thinking...

break through 2009 upper trend line FAKE or REAL it might sounds crazy, but if this break through holds. We are in for hundreds of points to come in the next few months.
KEEP IN MIND, that Elliott wave, Bollinger B, seasonality and many other analyst say that we r at a TOP or near a TOP ?!
time of watching closely anything could happen at any time. Just remember this cycle 2009 to today is longer and it's extended
much more than the previous ones. and every analyst you see talking about it They ALL FAILED AT Picking UP THE TOP SO FAR ?!
wish everyone the best.


SPX Breakout to PullbackDivergent RSI on latest pushup; gap to fill at 3305, move might terminate in 3450 area of former consolidation.
Not trading advice; just an idea, trade at your own risk; GLTA!

Dow jones good long candidateDow jones bullish AB = CD pattern formation ,, also trend study and RSI divergence,, indicated good bullish move can be seen

Bajaj finance bullish Good long candidateBajaj finance spot cmp 3090
Bullish AB= CD pattern formation
PRZ at 3080-3070
pattern violation below 3050 once sustain below this levels for 15 mins

Short Trade IdeaRSI divergence, break of 50 EMA (red), sell on Fibonacci level at 0.5 and 0.382, also at support turn resistance level.

Divis Laboratories Sell for TGT 2850RSI Divergence on Daily Chart
Window / Gap from Rs.2784 to Rs.3063
Considering Stock has closed around Rs.3050 for 2 consecutive day, any fall from hereon would cause the stock the to fall to Rs.2784 levels.
Suggestion: Sell a Call at CMP 3050 / 3000 with a SL Rs.3120.

Airtel Monthly AnalysisBharti Airtel seems to trading in the range of Rs.240 to Rs.450 on Monthly Charts.
There is also a RSI divergence for Feb 2020 & Jul 2020, thus the big fall from high of Rs.596.
It’s monthly 20 SMA is placed around Rs.429. If it breaks 429 it might take support @ Rs.400 or Rs.370 or Rs.350.

$PCTL is one to watchMacD Crossing today
Stock RSI 54
RSI 43.54
Share holder conference call scheduled for Sept 29th
Revenue is increasing
Applied for Uplisting to OTCQB
Sales force has expanded into the UK markets, as well as across the USA
Share profits currently up 620% YTD
Amazing company for both mid term and long term holds

RSI 15Nice divergence off of the 15 min USD/CAD,
Patience is key to any trade. Don't make 5 trades, Make the one you know will will be worth 5.
RSI is one of the most classic indicators everyone should master.
OANDA:USDCAD

A good triangle setup A possible triangle pattern, the RSI divergence shows a nice opportunity.
The stochastich suggests a good oopportunity to enter long, but it is better to wait the break-out!
Comment below, I'm interested in your opinions!

Retesting previous resistanceAfter multiple targets been hitted arround 32-33k sats. Serum lost it's momentum and went into a down phase. It's now retesting the previous resistance. Which shouldn't be to hard to break, since it has shown a strong Previous breakthrough on it's second try.
The RSI shows some hidden bullish divergence. But however it's not within the same white range box as on the chart. So either the momentum goes on hit the overbuy range, touches the first resistance(25k sats). Or this goes into consolidation, retests the green area and touches the resistance area later on.
Am pretty bullish on this project, so I expect this to run very high in the long term.
First targets on the chart.
Stop loss under 14.5k
Not a financial advice. Do your own research!
