BTCUSD bounce incoming!- 30min #RSI bullish divergence
- Sell volume steadily decreasing with each dip
- Classic three drives pattern
Rsi_oversold

Ever traded EURAUD before? We have taken a long position on EURAUD.
1) It is an uptrend on H4 and D1.
2) Oversold on M30, M15
3) Divergence present.
Reversal is complete so we have entered at 1.4750

2 period RSI + limit ordersThe 2-period RSI is really erratic and produces a lot of signals. A lot of the signals are good, but if you're trading with one singular position, you might run into trouble pretty frequently. So, I have something for you to try.
On *any* of these candles that close with the RSI above 90% or below 10%, you'll place a trade. But it won't be a big trade. You want it to be just big enough that you'll be reasonably happy with your profits if that is indeed the reversal point, but not so big that you're afraid of a little (or a lot of) drawdown.
Both of those candles have an RSI closing above 90%. What if this continued for another 5-6 candles before dropping? You don't know what the market will do here, so you don't bet big. Your trade setup might look something like this:
The market sell might be 1.00, and each limit order might be 0.10. Maybe you have 30 limit orders, for a maximum position size of 4.00.
Ideally, you'd be closing all of them when the price reaches the next bottom on the RSI, and then you'd be reversing and starting over. Sometimes that won't happen and a higher time frame momentum move will snuff you out, so make sure you measure your risk carefully!
Sometimes none of your limits will get filled. Sometimes only a few. Sometimes all of them! You never know. The 2-period RSI gives you a pretty good location to start placing limits, though, if you prefer to keep an indicator on your charts.
Few more examples:

RSI Crash Course - Why Most People Get REKTHere is a quick crash course on how I use the RSI along with Elliott Waves.
- Using the 20, 30, 40, 60, 70, 80 levels within the context of the trend to spot entries
- How to spot uptrends and downtrends with support and resistance
- How to spot big 3rd wave moves
- Using divergences to spot the end of a trend
This can be used on any time-frame but I just use it on the daily for this example
Like anything in trading, the RSI is more complex than most people first suspect. However, I hope this tutorial simplifies it enough for you to improve your trading
P.S. Video cuts out part way into my example, but you get the full tutorial and setup on how I use the RSI
Hope you have a great day trading,
Tchau

$LINK | Short Term Long With LINKUSD touching the 200EMA on the hourly, this could be a good spot for a push back to previous area of around $7.12 in the short term especially at extreme oversold levels. This isn't a long term BUY as $LINK has to make it past the downtrend line for me to consider a massive move but in the meantime might as well make a little gain. Good opportunity and based on previous movement, place stop loss below the swing low.

$EURUSD | Quick 25 Pips On The BottomSaw EURUSD coming back past the major support zone and replicated my previous trade from before for a quick 25 pip win here. This was in and out & quick. Oversold massively on RSI levels and at a previous bounce point. Easy 1:1 here.
Sentiment is still weary for EURUSD as it continues to struggle in this zone.

🚀😝$RVLT #RevoltToEarn #revolt2earn Short-Medium Term Trade😝🚀While $RVLT, the governance token for the "Revolt 2 Earn" DAO, is still very new in its lifespan, there seems to be a great long trade set-up here. $RVLT is the sister token to $CULT, the governance token of the Cult Dao. This is a trade set-up I, personally, have been waiting for very adamantly. I will be personally holding most of my $RVLT much longer-term, however there is a great set-up here for a possible 3X-5X return on a short-term to medium-term long.
Assuming that the entire market doesn't crash down to nothing-ness, then this long should potentially hold up very well. $RVLT has broken out of the narrowing, descending channel that it has been in for the past month. This could result in some short-lived sideways movement, followed by a reversal in (Short-term to medium-term) trend. This coincides with the both RSI's sitting at very oversold levels, adding more confluence to this trade idea.
My personal best buy price is $0.0000000781. However, any buy within the range between $0.0000000662 & $0.0000001095 would be a great buy-in price, with a SL below the previous swing-low. TP range for a 2X-3X return would be anywhere between $0.0000001738 & $0.0000002338, and a 4X-5X return would be anywhere in the range between $0.0000003837 & $0.0000004394.
**This is my opinion, based on my own interpretation of chart data, and is not financial advice of any form.**

AZN entry opportunityAZN offers a good entry at the $60 level with a well calculated risk 1:3.
The further discussion about the next vaccination, the upcoming winter and the oversold RSI should trigger the stock into profit pretty well.

First bounce with valid RSI support First, this is not entirely my idea. Someone posted it in chat, and then deleted it immediately and then I couldn't find them or their chart. But I saw it long enough to get the picture. The 3 bounces prior to this one since $17.8, have all crossed over above 30 on the RSI, on the 4 hour. Generally those aren't oversold enough conditions to make significant impact.
This one is different however, as you can see it crossed below the 30, and that's a bullish signal. Couple that with the double bottom and it makes for a compelling case for a strong rally to the upside. In any case, I'm staying cautious, leaning a bit bullish. Will place some longs if we can get clean above $21,500. But they will be tightly controlled as things are tricky to read right now. There are other indicators working against BTC too of course.
Zoomed in, the chart actually shows a triple bottom forming on the 15m, which is like a double bottom, but more specifically a reversal signal. Regardless of all of this, the chart zoomed out, at a glance, looks quite sketchy, IMO, but I still think we go to low $22k.

QQQ/SPY Topping Pattern?Pretty interesting relationship between QQQ vs SPY.
QQQ/SPY started massively deviating from the long term trend around March 2020.
We've since reverted to the mean a bit, and are now potentially showing signs of a top, which would mean QQQ is set to underperform vs SPY.
Double top scenario:
-we get rejected off the 21-week EMA, then break down from the channel.
Head & Shoulders top scenario:
-we rally a little longer up to the resistance level of the channel but then get rejected, forming a downward sloping H&S.
It would make sense if we saw QQQ underperform and then revert to the long term trend. However, the RSI is showing that we are very oversold, so perhaps this rally has more room to go.

BAC expected to rise towards $37BAC stock price is trading at a major Fibonacci retracement level. Price is in bearish trend making lower lows and lower highs. There is no sign of a reversal yet. The RSI is not making lower lows, producing bullish divergence signals. I believe that the most probable scenario is for BAC stock price to form a bottom and signal a reversal to the upside soon, this expected reversal will eventually push price towards $37. I would certainly NOT be bearish BAC at current levels with current technical conditions. I would be looking entry points for long positions in order to trade the bounce.

RSI Trend Strategy GuidelinesThe RSI is a versatile indicator, and can be used to provide entry signals during a trend. To get the signals a moving average is applied to the RSI.
1. Trades are only taken in the direction of the trend. For an uptrend only take longs. For a downtrend only take shorts (puts).
2. During a downtrend the RSI must move above 60 to indicate a pullback. When the RSI crosses back below its moving average (can be at any number, just as long as the RSI is or was above 60 recently) go short.
3. During an uptrend the RSI must move below 40 to indicate a pullback. When the RSI crosses back above its moving average (can be at any number, just as long as the RSI is or was below 40 recently) go long.
4. Give the price at least two or three bars (whatever time frame you are trading on) or more before considering an exit. This gives the price some time to move in your favor.

USD - It's time to moveThe Stoch RSI can be a very helpful indicator once you know how to use it.
1. Only use it when the price is in a trend.
2. There is no overbought in an uptrend and no oversold in a downtrend.
Anyway, as you can see on the chart, it's time for the USD to bounce back up.

btc 4H channel structureBest Trader ,
as you see the btc inside a channel , until yet i dont have any price action for confirming (short or long ) , if you see this structure on 1H you will find the RSI on bottom thats why i,m afraid to go short , i will wait maybe for a trap with price action so i have more confirmation
thanks

$1750 is the level to watchETH has been looking particularly strong throughout this relief rally, but I'm expecting resistance around $1750-$1800. This is a strong historic support/resistance level, and we can expect short pressure to pick up and long pressure to drop off substantially here. So a break above this level would tell me the bulls are back firmly in control.
It's also worth noting that we saw the weekly RSI dip below 30 at the recent local bottom ($880). The last time that happened was at the 2018 bear market bottom. I think the price action around $1750 will provide a lot of insight as to whether $880 is our current bear market bottom, or just another local bottom of a continuing bear market.

BTCUSD weekly (06/07/2022)Today we are going to see the extended triangle model that is forming the price of the BTC /USD pair in weekly candlesticks, below of the pattern we have left the acclaimed 200-period moving average (200MA), one of the most important resistence on the bitcoin cycles, we are below that resistence but only temporary. RSI in addition touches on the relative outside lows (oversold). Last cycle ATH is making furthermore a Buying level.
A possible trend change is coming around that leves in the next weeks/months.
Remember that it's very important to have liquidity for these macro-scale price action zones.
I hope that this analysis will be of great help to those who doubt about entries in these areas
;D

How do we ride through the selloff storm?Joining a global commodities rout, Soybean Oil had a rough time in the past 2 weeks, tumbling close to 22%. The move precipitated after breaking the 6-month uptrend and has struggled to find support until now.
After bouncing off the $65 support level and the 61.8% Fibonacci retracement, prices seem to have found a floor, ready to make the next leg upwards.
Zooming out to the daily candles, we see Relative Strength Index (RSI) deeply oversold, with only 2 other occasions since 2015 where the RSI reached such levels. One was in 2015 and the other one in 2020.The 2015 instance was followed a 50% price increase from the low of the RSI and the 2020 one was followed by a massive 196% price increase.
The sharp selloff, strong support levels, and historical precedence allow us to favor the long side for Soybean Oil.
Entry at 66.87, stops at 58.3. Target at 78.9.
Disclaimer:
The contents in this Idea are intended for information purpose only and do not constitute investment recommendation or advice. Nor are they used to promote any specific products or services. They serve as an integral part of a case study to demonstrate fundamental concepts in risk management under given market scenarios.

AUDCHF Long PositionThe price has formed a falling wedge pattern. We expect the price to keep following this trend. RSI is under the 30 threshold, this indicates that AUDCHF is oversold. We are looking for 50% Fibonacci retracement.
Target: 0.688
Entry: 0.674
S&L: 0.669

CADCHF Long PositionThe price has formed a double bottom, so we expect the price to break in the upside. The RSI just crossed the 30 threshold, this an indicator that CADCHF is oversold.
Target: 0.764
Entry: 0.747
S&L: 0.739

BTC is oversold. We are going to see BOUNCE BACK soon!!!Hello Everyone,
I was trying to make an analysis for possible bounce from last 1 week but was not able to get any glimpse on it. But, Today, after 1D candle closing, i see something which is saying few things.
*We are experiencing strong drop over the last few weeks. We can clearly see Bitcoin is now oversold levels. Daily and as well as in Weekly. we are looking at such low value of RSI after very long time.
* RSI value in 1W chart is 12.56. (Just check the chart to see RSI value. When was this number last seen?)
*As we can see on the chart that Bitcoin is trying to make support by sideways consolidation pattern in 4H and 1H timeframe. In 1D and 1W, BTC is oversold. We may see a little pump soon. But, aware!!! we are not out of bear market. I am expecting more downwards trend in upcoming days and we may touch the level of 16K.
*This is a short analysis for BTC which is showing a smart bounce very soon. Also, today is Saturday and we are closing 1W candle soon which is testing 250MA support . so bounce is expected.
Kindly manage your risk accordingly and never forget to put stop-loss while trading. Its really important in such bear market. HAPPY TRADING!!!
Please follow, like and share your ideas for improvement in our community.

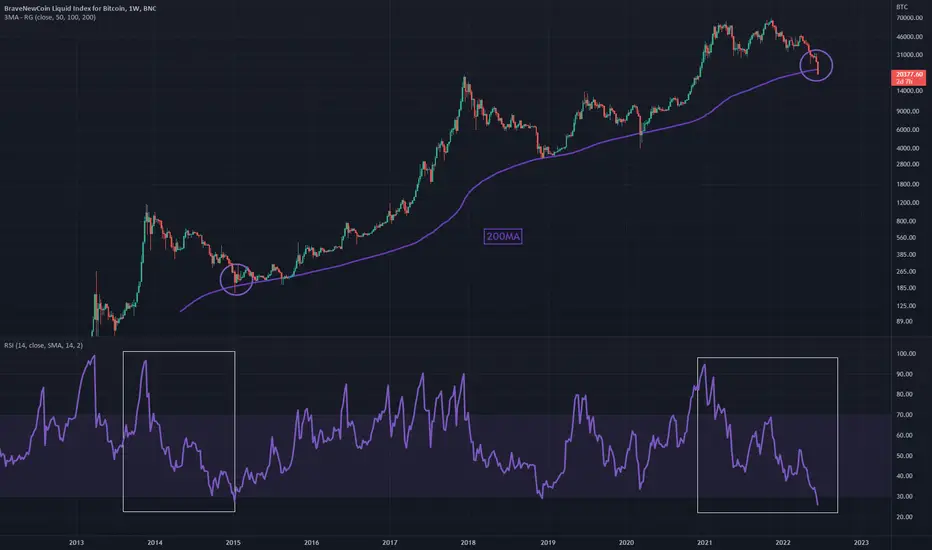
Bitcoin RSI Awareness BTCUSD Extremely similar RSI formations
Bottoms along 200MA is a common trait between the two structures
Entry now is great for long position
I hope a parabolic run follows this one, as it did the prior
Weekly Chart
Is it a good time to buy BTC?INDEX:BTCUSD According to RSI it looks like it is.
Can it go down? Absolutely YES!
Will it go down? Could be.
Will it go up? Probably YES!
Disclaimer:
This is not financial advice.
Make your own research and act accordingly.
Cheers!

ETHUSD potential bullish pushThe price has formed a falling wedge, we expect the price to break to the upside. we are looking for 50% Fibonacci retracement.
RSI: Is below the 30 threshold, this means that it is oversold. we are expecting upcoming bullish momentum.
Target: 2260
Entry: Buy zone in chart
