Ali Health (241)Daily chart, RSI resist breakout
- pretty subjective, sometimes requires 2 points (black triangles) to form the resist, sometimes one point is enough
- sometimes there is a pullback (red triangle), but sometimes it may not
Upside - $6.40 and above
Rsibreakout

Awaiting doge breakout of channelDoge is in a declining parallel channel. Awaiting breakout of the channel, and clearing the moving averages will setup a long to 0.96, then 0.108 and 0.146 resistance levels.
The rsi is also supportive of such a move with it currently trending upwards and not in an overbought position.
The MACD is also beginning to trend upwards with the MACD line crossing over and signalling a upward trend.
The rate of change ROC is also trending upwards but a note of caution: a pullback in the roc and then the breakout would result in a stronger indicator signal.
Volume is also starting to trend upwards over the past week compared to the preceding period of 27 Feb to 08 Mar, this signalling a move is impending which will have market support (and is more likely to form a trend as opposed to just a temporary spoke or bull trap).
İf taking a long position, depending on risk appetite, putting in a filter of 3 days from the breakout to avoid a bull trap might be advisable.
Alternatively, rejection of the upper boundary of the channel and/or moving averages will setup a downward mice to 0.69 then 0.67 and then to the bottom of the channel.
Best approach is to await a decisive action and enter then with SLs based on chart structure.

INVERTED HEAD & SHOULDER FORMATION !!!#OBEROIRLTY📊
👉Inverted Head & Shoulder Pattern📈📉
👉Breakout above 890+ Closing✅
👉Entry after Breakout
👉After Breakout possible targets 930/950/1000+🎯
👉Add to your watchlist👍

PFC FRESH BREAKOUT !!!Hello to everyone
The price consolidating in tringle from last 12 years and given fresh breakout towards the upside, also retested in lower timeframe. Chart looking strong in all time frames. Its good opportunity as an investment point of view. Expecting good upmove towards the upside.
#PFC
👉PSU Stock on radar.✅
👉12 years triangle consolidation.📈📉
👉Big upmove possible as investment
👉Support at 130
Traders, if you liked this idea or if you have your own opinion about it, write in the comments. I will be glad.

BATA INDIAHello and welcome to this analysis
Stock has made a bullish Harmonic Gartley and in this process has also made a double positive regular RSI divergence.
After such a sharp downfall stock has done a couple of candles in a consolidation zone and now could rally till 1600 with a smallish block near 1525, as long as it does not breach below 1380.
Good risk reward scenario at this juncture
Good luck with your investing

#BHARATFORG Bullish Momentum View!!!!!The Price perfectly respecting the change in polarity level. Weekly & Daily chart showing good momentum.Price breakout the resistance level and after breakout price persisting itself near CIP level & stucked itself in tight range and holds itself near higher levels.Expecting good breakout in coming days.Good opportunity to take long position after breakout of range. After breakout of level 920-- 925 we can see good price moment towards upside.
**PRINCIPLE OF CIP** :- Principle of Change in Polarity. According to this principle, whenever support is broken, its role is reversed and it begins to act as new resistance. Similarly, when any resistance is broken, it changes its role and tends to act as the new support level for the price.


Wonderla holidays breakout A very good breakout has been done in wonderla holidays with the support of RSI
Buy it at 361
Target 375 384 396 420
Sl 331


BTCUSD - RSI RecoveryRecurring RSI pattern that shows a higher low double bottom pattern
This is shown in white rectangles
A strong reversal sign

XRP Breakout 16/22 - .44 Cents Min Target (Symmetrical Triangle)XRP potential upwards Breakout by Friday 16/22 - .44 Cents Minimum Target
.618 Golden Ratio Fib retracement
Symmetrical Triangle pattern
Ascending Channel RSI

Everything I've learned about the RSI BINANCE:BTCUSDT
In this post, I'll make an attempt to share everything I've learned over the Relative Strength Index (RSI) Over the past 24 months.
Nothing described in this post is financial advice, it's just me, sharing thoughts and ideas with you.
nb: this post is more suited for traders and investors that are already educated about the RSI Indicators.
A brief introduction about the indicator itself :
The relative strength index (RSI) is a momentum indicator used in technical analysis. RSI measures the speed and magnitude of a security's recent price changes to evaluate whether it's better to buy, sell, or wait.
The RSI is displayed as an oscillator (a line graph) on a scale of zero to 100.
The RSI is probably the most used oscillator in finance nowadays, by both retail traders and institutions, hence meaning that when used well , it can be used as a great edge to profitability.
RSI popular uses :
- An asset is usually considered overbought when the RSI is above 70 and oversold when it is below 30.
- The RSI can give us insights on a potential trend's loss of momentum or validity when the price pivots levels are diverging with the RSI indicator (hidden and regular divergences)
- The most popular RSI length is 14 periods.
My findings
1. Overbought and oversold: myth or reality?
RSI's 30 and 70 levels never proved themselves to be a strong enough edge for me to be used as a standalone signal for trade entries.
As an example, just look at the irregularity of the results you would get when using just these zones :
My take on it is that as a price oscillator when it crosses into extremes, it simply means price momentum is at extreme levels. To me it's basically like a mountain cyclist in the middle of a race: he might very well go faster and higher, however, the quicker and higher he goes the more unlikely he is to keep up with that speed. Eventually, he might either decrease its speed or even go backward.
What does this tell us ?
The RSI 30 and 70 levels seem to be better used when used as timing indicators. For example, the 70 and 30 levels could be used as a filter for a trader to eliminate market noise when using a trend reversal strategy (mean-reversion). For trend traders, the levels could be used to timing signals where they'll start looking for price to do a pullback (consolidation) to get in the trend.
My experience using the 30 and 70 levels as exit signals however has been better (when it comes to using it as the only signal for a trade exit).
Say you are long on BTCUSD, in profit, and you get an RSI closure above 70. Well, in that case, you could exit 50% of your position and wait for the oscillator to cross down the 70 levels to exit the rest (as the overbought and oversold zones are rarely a defining factor for trend reversals and corrections).
2. Divergences in the overbought and oversold zones :
The lower the time frame you are trading on is, the higher the noise when it comes to divergences, especially with volatile assets such as BTCUSD. So you might want to filter out most of the ones you see to only take the best ones.
On the 15M and 5M timeframes, on BTCUSD, I find that on average about 1/3 of the divergences I see play out. However, we are not expected to take every divergence we see.
Here's what has helped me get better results with divergences :
- When approaching supply and demand zones, especially the higher timeframe ones, we might want to be more aggressive with the divergences we enter into. As the hit rate is not always amazing, the R:R is usually much better, and if the trade works out, it might give you great results which accounts for the low win rate.
- If you want to increase your win rate, I also find that going for higher timeframes is usually better when it comes to divergences.
- Take only divergences where RSI divergence's first pivot point is over 70 or under 30. Ideally, you don't want the noise to go below 60, or above 40, so that your trade has the necessary momentum to play out.
- For extra confirmation, wait for a break of the noise level to enter the trade.
- Regular and hidden divergences play hand in hand creating a form of momentum equilibrium. Hidden divergences always create regular divergences and vice versa. Hence a hidden divergence can be considered an early pullback warning to get in a bigger-picture trend.
- Regular divergences tend to play out better than hidden divergences. This is especially true when the volume is decreasing, or after a longer period of consolidation when volatility has been contracting and might be about to expand soon.
- Regular divergences in strong trends can be both a disaster and a treat. "The trend is your friend". This saying is especially true here. However, 2-3 drives of regular divergences are a great indication of a potential reversal, with enough confirmation factors to produce (often time) a great entry.
- The angle of the trend line between divergences pivot points, both on the price chart and the RSI, can be a good indication of the severity of the divergence occurring.
- The ideal lookback period for detecting divergences for me has proved to be between 5 and 28 bars. (Below 5 bars is not enough to confirm a true pivot point for me and above 28 bars has probably already played out in past price movements).
- Like all edges, using a divergence strategy always produces better results when used in confluence with other signals. I find the best confluences happen when divergences occur: alongside a stochastic cross, near medium-slow moving averages, near horizontal supply and demand zones, alongside volatility expansion, when the volume is decreasing (meaning market makes are in disagreement with the move occurring), near Bollinger bands 2.5 to 3 standard deviations (period 20).
- Convergence between your timeframes and higher timeframes is key to understanding how to better choose your trades. Try to play the big divergences but enter smaller timeframes divergences.
- When you lose a divergence trade, don't get disappointed. Jump back in because often time, and price will need to do several divergences before getting in your desired direction (however, be careful not to jump in tilt mod. Know your win rate and R:R and keep your money management serious. You'll get blown out if you start tilting on this, especially if you trade reversals with divergences, as it's difficult to get the right timing every time).
3. RSI as a trend filter?
- I've found that in trending markets, when RSI's Exponential Moving Average (EMA) crosses above the 50 line, it's an indication of an uptrend and vice versa. However, this is less effective in ranging markets as there's more noise, hence more invalid crosses.
- I've found that in trending markets when the RSI line crosses above the EMA (I use a 12 period), it's an indication of an uptrend and vice versa. However, this is less effective in ranging markets as there's more noise, hence more invalid crosses.
- As an indication of the trend's direction, I don't find any value in using bullish and bearish control zones. The only use I can find them is when using them for divergence levels filters.
This is the end of the first post of this 2 parts series. There's just so much more you can discover about this indicator that it simply cannot be constricted to a few lines of writing. However, you are welcome to take a few of my findings and go test them out using replay and backtesting. See for yourself, and find your balance.
Most of my learnings have been made through screentime, trial, and error, backtesting, mistakes, and research.
Have a good day,
Arthur Girard

BTC USD prediction 12-11 short positionDear traders as we see in the chart 1h time frame we found short opportunity,, depend our analysis the price make a consolidate for moving down on important resistance and also the price under all the ema line ,, so if the price break this consolidate then the it will moving down ,, also as you see the rsi indicator give short signal and adx indicator give us the same signal for short

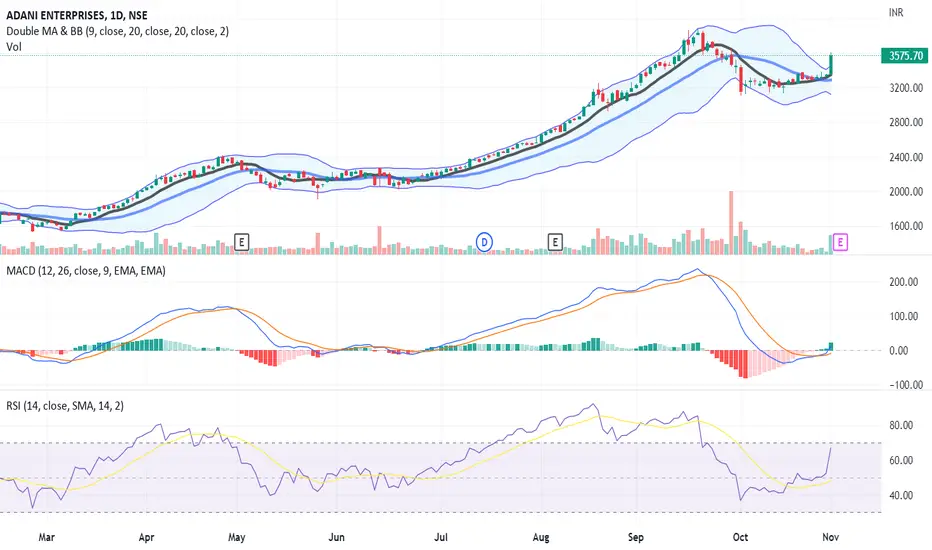
ADANI ENTERPRISES LIMITED - Volume Breakout + Bullish on Chart📊 Script: ADANIENT (ADANI ENTERPRISES LIMITED)
📊 Nifty50 Stock: NO
📊 Sectoral Index: NIFTY 500 / NIFTY METAL / NIFTY NEXT 50
📊 Sector: Commodities Metals & Mining
📊 Industry: Metals & Minerals Trading
Key highlights: 💡⚡
📈 Script is trading at upper band of Bollinger Bands (BB) and giving breakout of it.
📈 MACD is giving crossover.
📈 Double Moving Averages giving crossover.
📈 Volume is increasing along with price which is volume breakout.
📈 Current RSI is around 67.
📈 One can go for Swing Trade.
⏱️ C.M.P 📑💰- 3575.70
🟢 Target 🎯🏆 - 3885
⚠️ Stoploss ☠️🚫 - 3417
⚠️ Important: Always maintain your Risk & Reward Ratio.
⚠️ Purely technical based pick.
✅Like and follow to never miss a new idea!✅
Disclaimer: I am not SEBI Registered Advisor. My posts are purely for training and educational purposes.
Eat🍜 Sleep😴 TradingView📈 Repeat🔁
Happy learning with trading. Cheers!🥂
ADSK Elliot Wave 5 in progress Auto Desk (ADSK) wave 5 in progress and trying to reach the target price of $238 - $240. This is on a daily chart. Wave 3 showed some extension so wave 5 might not complete its full course. Another confluence is that RSI Crossed 50. Also, the MACD Line crossed the signal line.

Resistance break in renuka sugar with the support of rsi A very good resistance in breakout in renuka sugar and they also have big support of rsi bcs a good breakout was also done in rsi with heavy buying
Buy it at 51.50
Target 55.60 56.65 59.60 63.20
Sl 41

GravitaThis stock has given good breakout from decending parallel channel with good intensity of volume, also positive divergences in RSI and Macd signaled on daily time frame before breakout. RK's mass psychological Cloud buy activated and RK's buy signal activated, Rsi breakout also making scenario more powerful, adx showing good strength along with positive Dmi, Overall looking good to go long, with respected levels.
Breakout along with good intensity of volume
Positive divergence in macd
Positive divergence in RSI
RK's mass psychological Cloud buy activated along with breakout also along with buy signal
Macd in daily positive crossover and Uptick and also above zero line
Macd in weekly uptick now
Breakout in RSI of daily time frame
Price challenging upper bollinger band
Dmi adx also positive on daily time frame
Most investors treat trading as a hobby because they have a full-time job doing something else. However, If you treat trading like a business, it will pay you like a business. If you treat like a hobby, hobbies don't pay, they cost you.
Disclaimer
I am not sebi registered analyst
My studies are Educational purpose only
Consult with your Financial advisor before trading or investing

IQE - nice setupBreak of 200MA, 50MA turning upwards and looking to cross next few sessions.
Rising RSI and MACD looking positive.
Recent trading update good.

Common RSI Structure (Falling Wedge) I keep seeing this RSI structure appearing everywhere
Here are two examples of two different coins
Both show a falling wedge pattern on the 4D timeframes
This is a strong bullish pattern and if it is applicable to indicators such as these the bulls are definitely coming

market conditions vs. RSI breakoutI've been waiting for this rsi breakout since May, but knowing a bit more now, I feel like this might be another fake pump. The utility fundementals are still there but market conditions are as we all know, not optimal. Would love to hear another view (or even the same view)

EURUSD, another breakout aheadAfter offering multiple SELL opportunities over the last year, the EURUSD pair is consolidating once again on the daily timeframe.
Similarly, the RSI Exhaustion at the bottom is consolidating.
Both these consolidations mean that the pressure is increasing and ultimately the pair will break either to the upside (trend reversal) or to the downside (trend continuation).
Remember to stay patient and always look for confirmation from the indicators!

Triangle break outits clearly appearing a triangle break out on the chart so we can expect a bullish run for BTC. in addition we have bearish trend line break out on RSI.
its better we wait for a pullback for a better long position.

How can do rsi in chart?? 👌👌👌How do we exploit? So must We have to find resistance became support (condition break trend line before) and we see rsi that support, Draw it line noticed how price respected 😉😉👌 merge it white your analysis.
