$BTC is still alive What do you think ?
We have two important levels
42.09 - 37.96
34.11 - 30.30
From the creation of BTC ; BTC never been below than 30.3 level
I think it can be a good indicator for any entry
Rsibreakout

Another Wheat cycle? - RSI AnalysisRSI has been consistent above the 50 level. Looks like another Wheat commodity cycle.

Multiple BULLISH signals for ADA✅Note the following signals:
1- The 4-hour resistance is broken.
2- It retested the broken resistance.
3- RSI has given a buy signal.
4. Cardano Whale assets have increased by almost 10% in the last 24 hours.

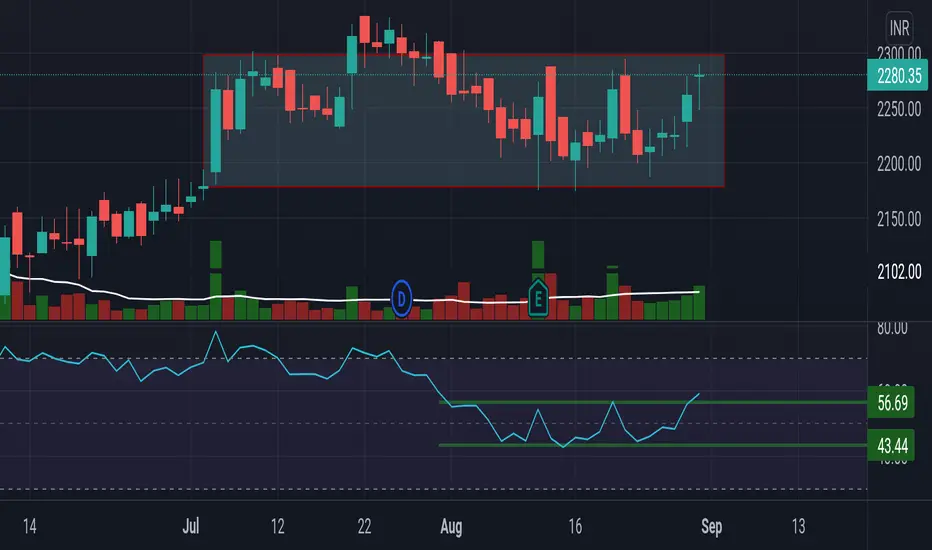
Redington Darvas boxRedington is consolidating in a range from 140 to 178 from past 8 months.
It is kind of flagpole pattern. Seems very bullish if it sustains above 180. A weekly closing above 175 can be a sign of breakout as well. RSI is becoming stronger.

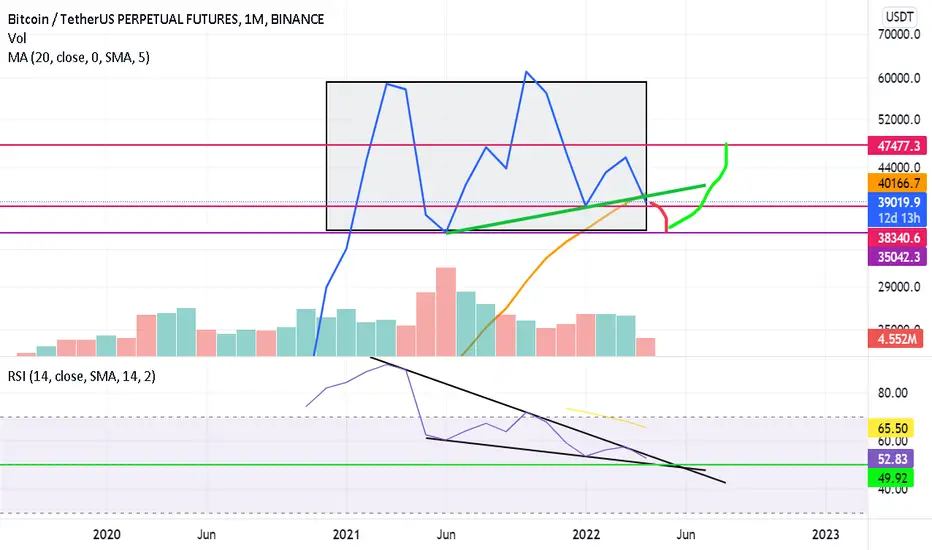
bitcoin can go to 35 k again!? hi friends ..
first look at the chart .. i prefer the line chart for monthly time frame
we have 2 important poin in this chart :
first :
The price is breaking the green uptrend line.
On the other hand, price is breaking down moving average 20 days (MA 20).
Since this is a monthly time frame, all of these breaks may appear as shadows
You can also see in the RSI indicator that the price has not yet broken the downward trend.
I think the price will go down to 35k.
The New Case In BITCOINOur long-standing case in Bitcoin now needs some revision in terms of a technical update.
First and foremost, and as anyone knows who’s followed me here on TradingView for some time now, you know I don’t do raw TA - and especially not when it comes to Bitcoin and crypto. No, I build cases. That’s why we land on our feet whilst most others crash and burn.
So what then is raw TA and moreover: what is a case?
Raw TA is simply to look at the underlying but without any context whatsoever, neither internal nor external.
Building a case, on the other hand, is to contextualizes things. It's a way to add on new and relevant and independent technicals and to revoke obsolete ones. But most importantly it’s to connect the interconnected.
In the case of Bitcoin I therefore add the strongest relevant technicals together in a constant flux. But even more so, it’s about comparing Bitcoin to mining companies and alt coins. By doing so we acquire a far more superior and holistic view in terms of risk and reward than could otherwise be attained. A case versus brute TA is like three dimensions versus two.
This building of cases is particularly of value to us at this very moment. It is precisely what we’ll discuss in today’s analysis.
Lately here on TradingView we've talked about how Bitcoin was preparing for a buy setup based on three individual technical criteria.
First we had the symmetrical triangle in the RSI on the daily chart in Bitcoin. This alone was never a buy signal, but rather a premature notification of upwards power to follow. A turbo, if you may.
Secondly - and the key aspect in this entire case - we had an ascending triangle in Bitcoin. Naturally, this would never break out unless the RSI were to break out first. Now we’ve had that triangle breakout and thus two of our three points are nicely checked.
That leaves us with the third and final one. The black sheep in this case equation, namely Marathon Digital Holdings.
Whilst Bitcoin took off by ten percent or so last weekend, I did expect a proportionate reaction in Marathon too … a blast through the horizontal resistance.
Yet, on Monday we saw no such thing. Initially, the stock made a futile attempt at breaking above, but it didn’t take long before it was back again in its God forgotten channel.
And this is where things get truly interesting and relevant. This is where our case begins, for as most inexperienced traders will base their entire position on the triangle breakout in Bitcoin, we know that such move will be limited unless Marathon follows suit.
For as long as Marathon is stuck in its range, there’s no way in hell Bitcoin will proceed up with free reign. For when Bitcoin runs … on the fairly rare occasions when it trends strongly and persistently … that’s when Marathon has its time to shine by grossly over performing versus that of Bitcoin’s spot price.
But by staying pat in its range and thus showing immense weakness and hesitation, it naturally follows that Bitcoin’s going nowhere.
Had Marathon broken out to the upside on Monday, however, it’d be completely different story. Instead, it’s start-of-the-week disengagement caused me to take another look at Bitcoin to revise our case. What I found was this: a diagonal resistance line that perfectly fits the Marathon bill.
And if we expand on this diagonal line, we quickly notice how it in fact amounts to an ascending channel …
or a bear flag if you may … for that’s precisely what it is until proven otherwise.
Now, bear flag or not, it doesn’t mean it’ll break out to the downside. We still have several check mate technical arguments for this area being a reversal point. We’re talking strong ones like the lower bullish red signals and the ABCDE triangle that is still fully in play. In this sense, I am still bullishly optimistic.
But be that as it may. We still don’t take longs at technical resistance! It’s just too risky. Going long here is far more dangerous than doing so here, once the price has broken out on the upside.
The ideal scenario right now would be for Bitcoin and Marathon to consolidate right below their respective resistances.
Yet, as counter intuitive as it may sound, such price action has a predominant bias to result in long-lasting and strong moves to the upside (or downside had it occurred at support).
With that said, if we can get breakouts in Bitcoin and (!) Marathon, then chances are we’re in for quite a ride. But no break, no take.
On a final note, this is precisely why our case approaches are of such high value. Had it not been for Marathon’s failure to follow suit, we’d be long stuck in a potentially fast-waning, high risk breakout.
Now, by updating and adapting our case to the new interconnected data, we can stay out of the way and rather target a low risk breakout rather being stuck in high risk volatility.
On that note, I wish you all a kick-butt awesome weekend!

$109 was the bottom? $BABA RSI hinting a breakout!Hey Traders,
As evident on the Weekly Chart of Alibaba (BABA), the Fibonacci Retracement looks like it matches up almost perfectly! Next, the Weekly RSI has something very interesting.. A descending resistance line is clearly present and if we are to break it, BABA would have a rebound to the golden pocket. The target is at .618-.65 ($238-$246) so set TP's/ Sell Orders there.
Safe Trading,
-Pulkanator


Buy Glenmark PharmaceuticalsGlenmark Pharmaceuticals is looking very bullish prior to its earnings.
Daily RSI has formed a huge inverted H&S with a breakout.
Down trendline broken
Price has crossed above 20 and 40 SMA on the daily chart
Three inside up candle pattern formation on the weekly chart

BTC BULLISH MOVE INCOMING!If BTC can break R1 $53,000 then we have lift off, it has also broken trend on the daily RSI so looking great for continuation.
I will keep you posted.
Safe trading.


SBIN - Triangle BreakoutSBIN Buy above high
Triangle Breakout coupled with volume
Pivot Breakout Coupled with volume
RSI Brokeout
Target between 5% to 8%

btcusd rsi daily analysischeck out my last rsi idea , after 7 months rsi in the daily chart breaks out the trend line and bannnnnng just look at that shit again and again


EURCHF sell opportunity 📉👌Our RSI reversal strategy has presented a short trade on EURCHF.
Previous trade which was also a short shown to give more of an idea on how the strategy works.
This is a new strategy script we are trialling at the moment.
Entry details are shown on the chart and we are working the 15M time frame.
Take profit is the green line. Pink line is stop loss.
Trade history can be seen below this trade idea too for full transparency.
------------------------------------------
I try and share as many ideas as I can as and when I have time. My trades are automated so I am not sat in front of a screen daily.
Jumping on random trade ideas 'willy-nilly' on Trading View trying to find that one trade that you can retire from is not a sustainable way to trade. You might get lucky, but it will always end one way.
------------------------------------------
Please hit the 👍 LIKE button if you like my ideas🙏
Also follow my profile, then you will receive a notification whenever I post a trading idea - so you don't miss them. 🙌
No one likes missing out, do they?
Also, see my 'related ideas' below to see more just like this.
The stats for this pair are shown below too.
Thank you.


BANK NIFTYIn WEEKLY time frame it has activated a Bullish Hidden RSI Divergence
In DAILY time frame it has activated a Bullish Sea Horse Pattern
These suggest levels of 36000/37000 as possible targets.
View gets negated below 32500
