DIVISLAB | Strong Volume Breakout from Multi-Month Resistance 📈 Trade Recommendation:
✅ For Intraday:
Buy Above: ₹6,250 (on sustained breakout and volume)
Intraday Target: ₹6,350–₹6,420
Stoploss: ₹6,180 (below breakout zone)
📊 For Short-Term (1–2 weeks):
Buy on Retest: ₹6,200–₹6,250 (ideal risk-reward)
Target 1: ₹6,500
Target 2: ₹6,750
Stoploss: ₹6,050 (below retest support)
🔍 Technical Highlights:
Volume surge confirms breakout strength
RSI breakout above 70 indicates strong bullish momentum
Past resistance zone now acting as support on retest
Rsibullishdivergence

SBIN Breakout Alert | Strong Volume + RSI Confirmation🔍 Chart Analysis Summary
Pattern: Stock has broken out of a clear consolidation range (highlighted in blue), suggesting bullish momentum.
Volume Spike: Notable surge in volume (blue arrow), confirming the breakout strength.
RSI: RSI has broken above the 60–65 zone, indicating strong bullish momentum.
Price Action: The breakout occurred above ₹775–₹780 resistance, now acting as support.
🟢 Recommendation: BUY
Action Level (INR)
Buy Above ₹785–₹790 (on minor dips or current price)
Target 1 ₹835
Target 2 ₹875
Stoploss ₹755 (below the breakout support zone)
for educational purposes only

RSI in BTC 4H time frame is showing Bullish DivergencesRSI in BTC 4H time frame is showing Bullish Divergences and if it works, price can go up to 66k. Keep in mind that there are significant caveats when entering long trades!
BINANCE:BTCUSDT.P

DXY RSI Bullish Divergence at Bullish Butterfly PCZFrom the looks of it, DXY will try to hold the 1.414 Butterfly PCZ and make its way up towards previous Resistance. I don't think DXY will Break the Resistance, but it does look like there is a good case to be made for DXY coming back up to challenge those levels.

DIXON BULLISH DIVERGENCE ON DAILY CHART!!!!Hello to everyone,
As we can see there is a Bullish divergence in RSI & PRICE on daily timeframe . This is indicating that price has not much momentum to go downside. We can expect a trend reversal in Dixon.
The price consolidating in a range from last few days. As per the theory of range, the price will go to the side on which the breakout occurs. But here the price is trading in oversold zone and BULLISH DIVERGENCE is also happening between PRICE & RSI on daily chart. So there is higher probability of that breakout will happens upside.
Dixon
👉🏻Added in watchlist✅👍
👉🏻Breakout possible above 2860+ close (Buy abv BO)✅
👉🏻Above breakout gap filling possible 3150 to 3350+🎯
👉🏻Quality stock👍
👉🏻Base support made at 2550👍
👉🏻RSI Bullish Divergence✅
Traders, if you liked this idea or if you have your own opinion about it, write in the comments. I will be glad

KOTAKBANK BULLISH DIVERGENCE at the SUPPORT ZONE !!!Hello to everyone,
Kotak Bank trading near weekly support zone & RSI Bullish Divergence also happening near support zone , which gives double confirmation that the price may go upside. So here perfect low risk and high reward setup.
#KOTAK MAHINDRA BANK📈📉
👉🏻Stock approaching strong demand zone✅
👉🏻 1690-50 Support👍
👉🏻Stock bouncing from support📈📈
👉🏻RSI Bullish Divergence On Weekly chart✅
👉🏻TGT------ 1770/1808/1855+
👉🏻Add To Your Watchlist✅✅

HindalcoHello & welcome to this analysis
In this chart we can see
a diagonal breakdown which bought the stock down to 380
where it went into form a bullish harmonic cypher
to be followed by a bullish RSI divergence
It could now attempt further upside till 425, then 440 & 455 as long as it sustains above 400.
Good set up for momentum at the moment.

Natural Gas BULLISH DIVERGENCE on DAILY TFThe price trading at Lower level and there is RSI BULLISH DIVERGENCE also on weekly chart which indicating that price has not much momentum and strength to go further downside .On the daily chart, the RSI indicator is also close to crossing below 30, Signaling overbought conditions.
👉 RSI DIVERGENCE does not confirm that the price will reverse but divergence indicates that the price does not have the strength to go down. So for any upside view let the price confirms the strong Reversal for any upside momentum.✅

RSI BULLISH DIVERGENCE ON WEEKLY CHART !!!!Hello to everyone
The price perfectly fulfills my last idea. The market was trading at all time high level of 1397 and fell from all--time high price because of RSI Bearish Divergence on weekly timeframe . The price hit the target of 1228. Now the price is near the strong weekly support zone . The level of 1200--1230 is strong demand zone and there is RSI Bullish Divergence on daily timeframe. The 200 day's EMA also at the support level which is performs as strong support . Near the support level RSI Bullish Divergence + 200 EMA can play a crucial role for swing reversal. The price can take support at the mentioned support level and may go upside for the initial upper targets. My first initial target is 1290 & 1330- 1360.
Traders, if you liked this idea or if you have your own opinion about it, write in the comments. I will be glad.

BAJAJFINSV RSI BULLISH DIVERGENCE !!!The price near ascending channel support of 1280--1320 and also there is RSI Bullish Divergence on weekly and daily timeframe. We seen a good correction in price an now price forming strong base to go upside. If price respects the channel support than than price can go upside for the targets of 1435--1500-1600 in next trading sessions.

RSI BULLISH DIVERGENCE ON WEEKLY CHART !!!!Hello to everyone
The price perfectly fulfills my last idea. The market was trading at all time high level of 1397 and fell from all--time high price because of RSI Bearish Divergence on weekly timeframe. The price hit the target of 1228. Now the price is near the strong weekly support zone. The level of 1200--1230 is strong demand zone and there is RSI Bullish Divergence on daily timeframe. Near the support level RSI Bullish Divergence can play a crucial role for swing reversal. The price can take support at the mentioned support level and may go upside for the initial upper targets. My first initial target is 1290 & 1330- 1360.
Traders, if you liked this idea or if you have your own opinion about it, write in the comments. I will be glad.

NATURAL GAS BULLISH RSI DIVERGENCE IN DAILY TF !!!Hello to everyone,
As we can see there is a Bullish divergence in RSI & PRICE on daily timeframe . This is indicating that price has not much momentum to go downside. We can expect a trend reversal in natural gas but only RSI divergence does not confirms the trend reversal. We need positive price pattern or any bullish candle formation to go upside at the bottom of chart. If any bullish candle or bullish scenario forms than only we can go for the long position.
The green candle indicating price momentum towards upside and green candle has good volume also ,which is showing strength in buyers./b]
Traders, if you liked this idea or if you have your own opinion about it, write in the comments. I will be glad.

RSI BULLISH DIVERGENCE Near SUPPORT !!!BIOCON Trading near strong monthly support zone of .. 223--- 210. There is bullish divergence also between PRICE & its RSI in weekly timeframe.
Price also taking support near demand zone.
#BIOCON📈📉
👉🏻Stock approaching strong Monthly & Weekly Demand Zone✅
👉🏻 223-10Support Zone 👍
👉🏻Stock Showing Strength from support📈📈
👉🏻 Good For Investment View📈📈
👉🏻RSI Bullish Divergence On Weekly chart✅
👉🏻TGT------ 243/258/280++ ✅
👉🏻Low Risk High Reward Setup🎯
👉🏻Add To Your Watchlist✅✅
Traders, if you liked this idea or if you have your own opinion about it, write in the comments. I will be glad.

Bullish RSI divergence on Delta Corp ChartNSE:DELTACORP
As seen on the chart, DeltaCorp has shown bullish RSI divergence as the price went lower while RSI went higher. There is a very high probability that DeltaCorp could reverse from here and could reach at least 200
Disc - invested, for educational purposes only.


BTC Marketcap Neutral Pattern with a Bullish EdgeBTC is trading within this Symetrical Triangle which is a pattern that happens to be Neutral but it's showing a slightly Bullish Edge in the form of the 4 Hour Bullish Butterfly anbd the 4 Hour RSI Bullish Divergence perhaps from where we are now we could atleast see some sorta action back above the top side of this consolidation structure.

Solana at PCZ of Bullish Shark with RSI Bullish DivergenceSOL is in a Descending Broadening Wedge Visible with RSI Bullish Divergence Visible on the Daily and MACD Hidden Bullish Divergence Visible on the weekly at the PCZ of a Bullish Shark

SOLUSD: Bullish Shark Looking For A Minimum 50% RetraceThere are alot of reasons to think it could go up even higher based off the much bigger Shark and Butterfly zoomed out to the left but for the day trader my focus is on this smaller local Shark with a target at around $40

BBGI | Wave Projection | Upcoming Inverse Head & ShouldersPrice action and chart pattern trading setup:
> Possible upcoming ending diagonal of intermediate 5-wave downtrend with inverse head & shoulders
> Entry @ breakout neckline
> Target @ approximately the height of the head 9 baht
> Stoploss @ upcoming right shoulder minor 5-wave
> Risk reward ratio: 2:1 with downside -6%
Indicator:
> RSI +50 cross MA and MACD bullish divergence
Always trade with affordable risk and respect your stoploss

ADAUSDT | Wave Projection | Bullish Divergence Apex TrianglePrice action and chart pattern trading
> Wave Pattern: Apex Triangle breakout with bullish divergence in daily timeframe - possible major uptrend rebound.
> Entry @ Apex breakout - key resistance SMA50
> Target @ 4-wave - upside +40% and TP2 @ SMA200 +80%
> Stoploss @ 5-wave lowest position -15%
> Risk Reward Ratio: 3:1
Indicator: RSI strong bullish divergence signal
Always trade with affordable risk and respect your stoploss

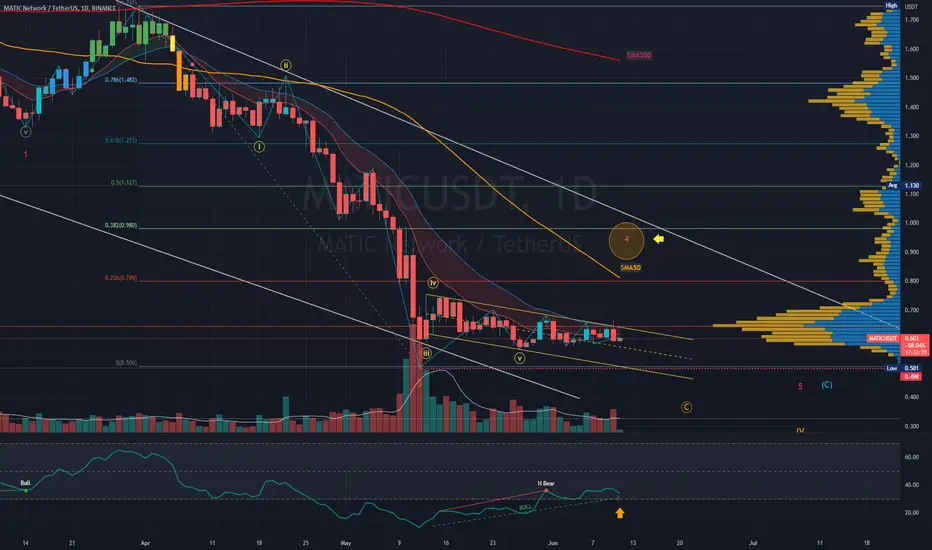
MATICUSDT | Wave Projection| Bullish Divergence for rebound?Price action and chart pattern trading setup
> Major formation: Ending diagonal with bullish flag reversal pattern, expecting a rebound for minor WAVE 4
> Targeting 0.382 retracement of previous WAVE 3
> Entry @ bullish flag breakout
> Stoploss @ flag support position
> RRR 3:1
Indicator:
RSI bullish divergence
Always trade with affordable risk and respect your stoploss
Double Bottom with RSI Bullish DivergenceThere is a Double Bottom Visible on the 1 Hour and RSI Bullish Divergence Visible on the 1 and 4 Hour

Strong buy in CAMSThere is strong rsi diversion in CAMS, the price was trading lower low but rsi is trading in higher low so, your first target will be yellow line which will give you a gain of 8% and if the price break yellow line with strong volume then your second Target will be at orange line which is again give you extra 8% gain.
And don't forget to keep trailing your stoploss !
First Target - Yellow line
Second Target - Orange line
Stoploss - Swing Low .
