Deep Dive Into Relative Strength Index (RSI)The Relative Strength Index (RSI) is a momentum oscillator developed by J. Welles Wilder Jr. that measures the speed and magnitude of price changes.
Introduction
In the world of trading, timing is everything — and few indicators have stood the test of time like the Relative Strength Index (RSI). Introduced by J. Welles Wilder in 1978, the RSI is a momentum oscillator that helps traders evaluate the strength and speed of price movements. Whether you're trading stocks, forex, or crypto, understanding how RSI is calculated and how to interpret its signals can give you a critical edge.
In this article, we’ll break down exactly how the RSI works, explore its formula, and dive into practical ways you can incorporate it into your trading strategies. From spotting potential reversals to identifying overbought and oversold conditions, the RSI remains a cornerstone of technical analysis — but only if you know how to use it properly.
Let’s explore the mechanics and the mindset behind this powerful indicator.
What Is RSI and How Is It Calculated?
The Relative Strength Index (RSI) is a momentum oscillator that measures the speed and change of price movements over a defined period. It outputs a value between 0 and 100, which helps traders determine whether an asset is overbought or oversold.
The default RSI setting uses a 14-period lookback window and is calculated with the following steps:
🔷Calculate the average gain and loss over the last 14 periods:
Average Gain = Sum of all gains over the past 14 periods / 14
Average Loss = Sum of all losses over the past 14 periods / 14
🔷Compute the Relative Strength (RS):
RS = Average Gain / Average Loss
🔷Apply the RSI formula:
RSI=100−(100/(1+RS))
The result is a single number between 0 and 100 that indicates the asset's momentum.
How to Use RSI in Trading Strategies
⚡️Overbought and Oversold Conditions Strategy
RSI > 70 typically signals that an asset may be overbought and due for a pullback.
RSI < 30 suggests the asset might be oversold, potentially primed for a bounce.
However, these levels aren’t absolute sell or buy signals. In strong trends, RSI can stay overbought or oversold for extended periods.
📈Long Trading Strategy Example:
1. Identify the major trend, to find the long trades it shall be uptrend. On the screen below you can see 1D time frame for BITMART:BTCUSDT.P .
2. Move to lower time frame (in our case 4h) and find the moment when RSI falls below 30. This is our oversold condition and we are going to look for long trade.
3. Find the local support zone and open long trade.
4. Take profit when price reaches resistance level next to the previous swing high
5. Don’t forget to put initial stop loss when enter position. The best stop loss which will give you 3:1 risk to reward ratio.
📉Short Trading Strategy Example
1. Identify the major trend, to find the short trades it shall be downtrend. On the screen below you can see 1D time frame for BITMART:ETHUSDT.P .
2. Move to lower time frame (in our case 4h) and find the moment when RSI grows above 70. This is our overbought condition and we are going to look for short trade.
3. Find the local resistance zone and open short trade.
4. Take profit when price reaches support level next to the previous swing low
5. Don’t forget to put initial stop loss when enter position. The best stop loss which will give you 3:1 risk to reward ratio.
⚡️RSI Breakout Strategy
RSI is breaking through 60 indicating bullish momentum shift if the long-term trend is bullish can be the potential long signal
RSI is breaking down 40 indicating bearish momentum shift if the long-term trend is bearish can be the potential short signal
This strategy works great only on the trending market, don’t use it on the range bounded market to avoid whiplashes.
📈Long trading strategy example:
1. Make sure that long-term trend is bullish. Use 200 period EMA as its approximation. If price remains above it we can look for potential long trade setup.
2. If RSI crossed above the level 60 open long trade.
3. Put the initial stop-loss under the signal candle’s low.
4. Take profit when price reached 3:1 risk-to-reward ratio.
📉Short trading strategy example
1. Make sure that long-term trend is bearish. Use 200 period EMA as it’s approximation. If price remains below it we can look for potential short trade setup.
2. If RSI crossed below the level 40 open short trade.
3. Put the initial stop-loss above the signal candle’s high.
4. Take profit when price reached 3:1 risk-to-reward ratio. In our case we received very fast and profitable trade
⚡️RSI Divergence Strategy
RSI can be used also as a trend reversal indicator if we are looking for divergences. This is very reliable sign of current trend weakness and great opportunity open trade against the trend. Usually it’s not recommended, but in case if divergence can be applicable.
Bullish divergence is the situation when price created the lower low, while RSI made the lower low. Usually, it indicates that current downtrend is weakening and we can look for long trades
Bearish divergence is the situation when price created the higher high, while RSI made the lower high. Usually, it indicates that current uptrend is weakening and we can look for short trades
😎Important hint: it’s rarely covered in textbooks about technical analysis, but in our opinion it’s better to used divergences when RSI was able to cross level 50 between two lows/highs.
📈Long trading strategy example
1. Find at the chart situation, when the price made the lower low
2. At the same time RSI shall set the higher low
3. RSI shall break level 50 between these lows indicating shift to the bullish momentum
4. If price failed to set the clean breakdown open long trade on the candle which set the lower low. Put stop loss under it’s low
5. Take profit at 3:1 RR. When you master this concept, you will be able to have much more RR trades, even 10:1. This is possible because when trend finish you have the highest potential upside
📉Short trading strategy example
1. Find at the chart situation, when the price made the higher high
2. At the same time RSI shall set the lower high
3. RSI shall break level 50 between these highs indicating shift to the bearish momentum
4. If price failed to set the clean breakout open short trade on the candle which set the higher high. Put stop loss above it’s high
5. Take profit at 3:1 RR. When you master this concept, you will be able to have much more RR trades, even 10:1. This is possible because when trend finish you have the highest potential upside
Conclusion
The Relative Strength Index (RSI) remains one of the most powerful and flexible tools in a trader’s technical arsenal — but its real value lies in how you use it.
We’ve explored three key RSI strategies:
✅ Overbought/Oversold setups offer simple entry signals in ranging markets, where price tends to revert to the mean.
✅ Breakout strategies unlock RSI’s momentum-tracking potential, helping you ride strong directional moves with confidence.
✅ Divergence detection reveals hidden shifts in market sentiment, giving you an early warning of possible reversals or trend continuations.
Each approach has its strengths — and its risks — but together, they offer a complete framework for using RSI across different market conditions
🔑 Key Takeaways:
RSI is not just a “buy low, sell high” tool — it’s a multi-dimensional indicator that adapts to trends, momentum, and market structure.
The best RSI signals come from confluence: combining RSI with price action, support/resistance, volume, or trend filters like moving averages.
Patience and discipline are essential — RSI signals are only effective when paired with proper risk management and confirmation.
By mastering RSI beyond the basics, you'll be better equipped to make timely, confident, and informed trading decisions — whether you're entering a pullback, chasing a breakout, or spotting the early signs of reversal.
Rsidivergence
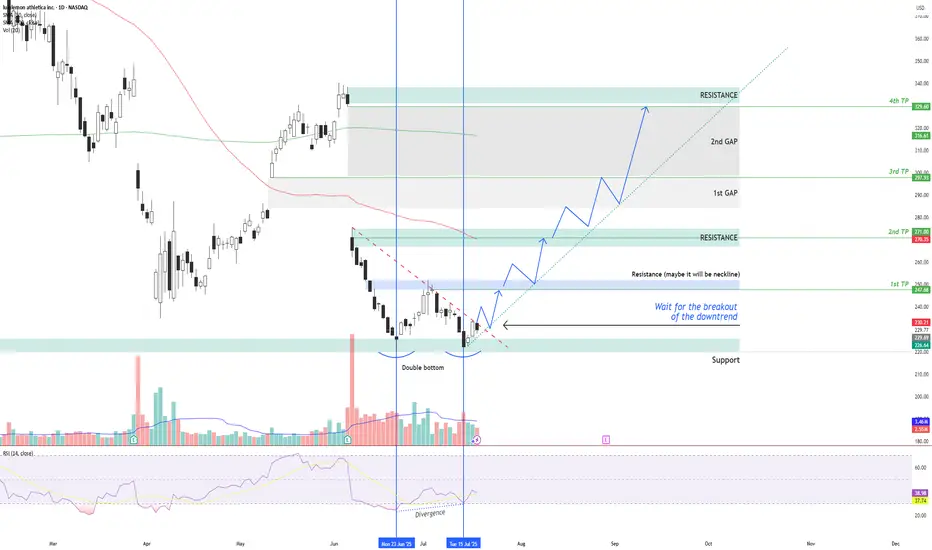
LULU – Double Bottom + RSI Divergence: Multi-Target Setup After LULU NASDAQ:LULU is showing signs of a potential bullish reversal after forming a double bottom structure around the $220 support zone , along with a bullish divergence on the RSI indicator.
Two vertical lines highlight the divergence: while price made a lower low, RSI formed a higher low – indicating a possible momentum shift in favor of buyers.
Currently, price is moving just below a descending trendline, which has been acting as dynamic resistance. The first condition for a long setup is a confirmed breakout above this trendline followed by a successful retest. If that happens, an entry can be considered .
📌 Entry Plan:
Entry: After a breakout and retest of the descending trendline.
1st TP: ~$247 — This level coincides with a local resistance zone, which may act as a neckline of the double bottom.
If price breaks above $247 and retests, it confirms bullish continuation.
📈 Target Structure:
2nd TP: ~$271 — next major resistance zone.
3rd TP: ~$297 — aligns with the first major gap zone.
4th TP: ~$329 — final gap resistance from previous sell-off levels.
This structure allows for scaling into the trade in stages — each breakout and retest offers a new confirmation and extension to the next target zone.
Volume analysis, price action, and RSI momentum all support the probability of a trend reversal — but confirmation is key.
Not financial advice. Always conduct your own research and risk management.
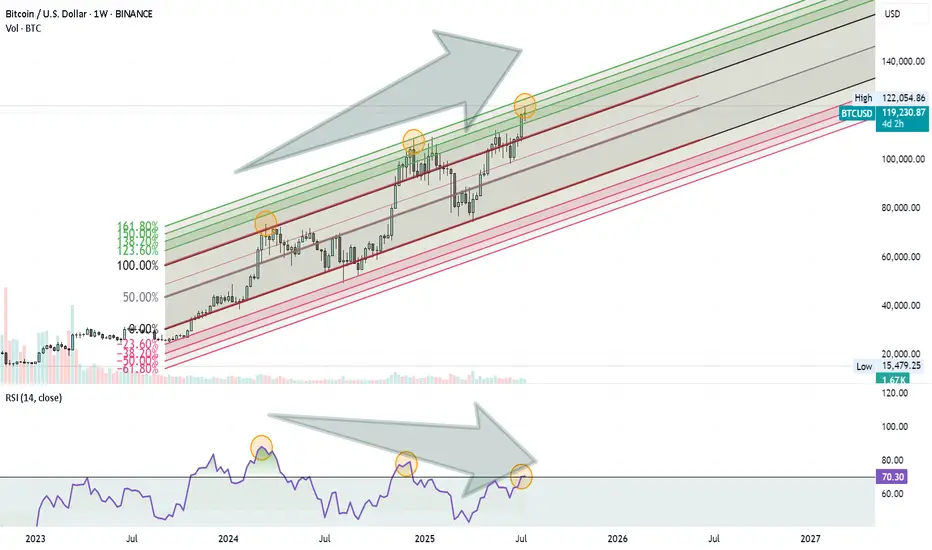
Bitcoin Rally Losing Steam?Bitcoin might be approaching a Turning Point . Here’s what I’m seeing on the weekly chart:
Price is moving inside an ascending Fibonacci channel.
It’s getting close to the 1.60 (160%) extension level, which has acted as a reversal zone before.
At the same time, the RSI is showing a clear negative divergence, suggesting that momentum is weakening.
These signs combined could mean we’re not far from a significant correction.
Nothing is confirmed yet, but it’s a setup worth keeping an eye on.
ETHEREUM for $750?In this chart, I am showing you the worst possible scenario. If we compare this cycle to the past, we see some very similar things on the weekly chart:
- Weekly RSI divergence
- Testing the 50-level RSI and the trend line from the bottom to the top
- Correction to the 0.5 fibbonacci level.
- Last time we had a war between Ukraine and Russia and now we have a war between Israel and Iran
- Last time everyone on X(twitter) was talking and cheering about Alt-Seoson and ToTheMoon and now we have the same situation, DYOR, check X
$750-800 for Ethereum are the lows of the two global channels. So it's a logical bottom. And after the price reaches the bottom, we can reach the top of the channel.
Hence after this mega-dump we will see #ETH at $18000-20000.
What do you think about this scenario?

Gold (XAUUSD) – Lower TF Wave (B) Top in Place? Higher TF Conflu⚠️ Price has now completed what appears to be a clean 5-wave advance into the key supply zone — potentially completing wave ((C)) of (B) on the lower timeframe.
• Wave ((ii)) = expanding flat
• Wave ((iv)) = expanding triangle
• Final ((v)) push into supply with RSI/MACD divergence
A breakdown below 3435 could confirm the reversal into wave (C). Downside fib targets align around 3400, 3350, and 3280.
A marginal high can’t be ruled out, but structure is now favouring bears short term.

HA-RSI + Stochastic Ribbon: The Hidden Gem for Trend & MomentumNavigating volatile markets requires more than just raw price action. The Heikin Ashi RSI Oscillator blends the power of smoothed candlesticks with momentum insights to give traders a clearer picture of trend strength and reversals.
At Xuantify , we use the Heikin Ashi RSI Oscillator as a hybrid momentum and trend tool. While the indicator calculations are based on Heikin Ashi values to smooth out noise and better capture trend dynamics, the chart itself displays standard candlesticks (real price data) . This ensures that all signals are aligned with actual market structure, making it easier to execute trades with confidence and clarity.
This dual-layer approach gives us the best of both worlds: clarity from smoothing and precision from real price action. MEXC:SOLUSDT.P
🧠 How We Use It at Xuantify
At Xuantify , we integrate the Heikin Ashi RSI Oscillator into our multi-layered strategy framework. It acts as a trend confirmation filter and a momentum divergence detector , helping us avoid false breakouts and time entries with greater precision. We pair it with volume and volatility metrics to validate signals and reduce noise. Note the Stochastic Ribbon Overlay as shown in the chart, very accurate for momentum.
⭐ Key Features
Heikin Ashi Smoothing : Filters out market noise for clearer trend visualization.
RSI-Based Oscillation : Measures momentum shifts with precision.
Color-Coded Bars : Instantly identify bullish/bearish momentum.
Dynamic Signal Zones : Customizable overbought/oversold thresholds.
Stochastic Ribbon Overlay : A powerful multi-line stochastic system that enhances momentum analysis and trend continuation signals.
💡 Benefits Compared to Other Indicators
Less Whipsaw : Heikin Ashi smoothing reduces false signals common in traditional RSI.
Dual Insight : Combines trend and momentum in one visual.
Better Divergence Detection : Easier to spot hidden and regular divergences.
Visual Simplicity : Clean, intuitive design for faster decision-making.
⚙️ Settings That Matter
RSI Length : Default is 14, but we often test 10 or 21 for different timeframes.
Smoothing Type : EMA vs. SMA – EMA reacts faster, SMA is smoother.
Overbought/Oversold Levels : 70/30 is standard, but 80/20 can reduce noise in trending markets.
📊 Enhancing Signal Accuracy
Combine with Volume Oscillators to confirm momentum strength.
Use Price Action Zones to validate oscillator signals.
Look for Divergences between price and oscillator for early reversal clues.
🧩 Best Combinations with This Indicator
MACD : For cross-confirmation of momentum shifts.
Bollinger Bands : To identify volatility squeezes and breakouts.
Support/Resistance Levels : For contextual trade entries and exits.
⚠️ What to Watch Out For
Lag in Strong Trends : Like all smoothed indicators, it may react slightly late.
Over-Optimization : Avoid curve-fitting settings to past data.
Standalone Use : Best used in conjunction with other tools, not in isolation.
🚀 Final Thoughts
The Heikin Ashi RSI Oscillator is a powerful hybrid tool that simplifies complex market behavior into actionable insights. At Xuantify, it’s a core part of our strategy toolkit, helping us stay ahead of the curve with clarity and confidence.
🔔 Follow us for more educational insights and strategy breakdowns!
We regularly share deep dives into indicators, trading psychology, and backtested strategies. Stay tuned and level up your trading game with us!

Bullish Divergence on Bigger tf.4337 - Closed at 4.35 (26.05-2025)
Bullish Divergence on Bigger tf.
4.15 - 4.30 seems to be a Strong Support.
But needs to cross & sustain 4.45 at
least for further upside.
It has the potential to touch 5.35 - 5.50
& then 6 -7

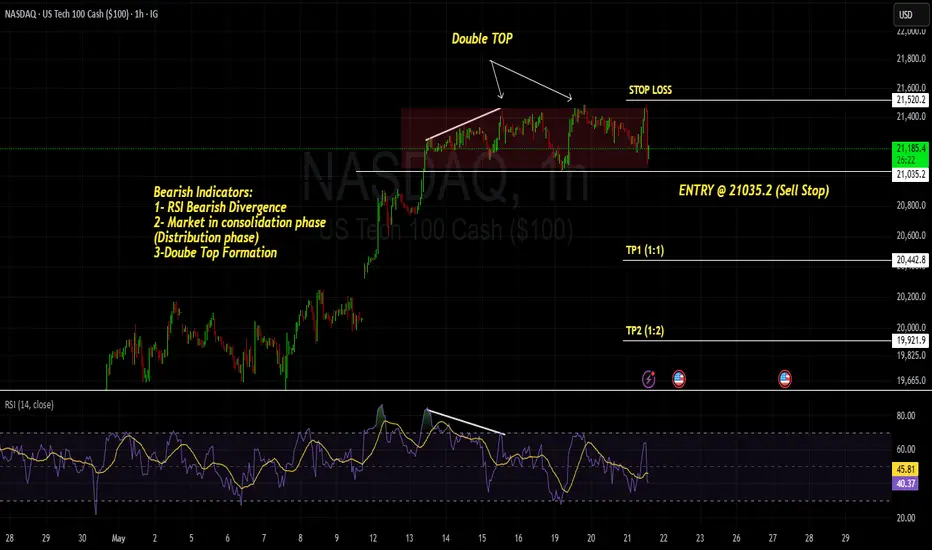
NASDAQ - SHORT SELL - AMAZING DOUBLE TOP PATTERN - REVERSAL patNASDAQ ; after forming series of HH and HLs is seem to be in distribution phase, we can see Divergence on RSI followed by Double TOP pattern which is a strong confluence for Reversal Pattern
we have a trade plan with our entry , once the accumulation phase (strong support) is broken as mentioned as ENTRY POINT (Sell Stop order) once our order is triggered we can place STOP loss above HL (or Resistance level) -
Our TPs would be TP1 with a Risk to Reward Ration 1:1 and other TP2 with R:R 1:2.
HAPPY TRADING GUYZ !!!!
"Better Trade your psychology and emotions, you will always be profitable"
Regards,
PROTRADEPROFESSOR
Fartcoin: Is the Smell of a Downtrend in the Air? 📉 Fartcoin: Is the Smell of a Downtrend in the Air? 💨
🚨 Alert: The RSI is holding its nose... and so should we.
After a suspiciously bubbly rally, $FARTCOIN is now showing bearish RSI divergence on the 4H chart — and let’s be honest, it’s starting to stink. 🦨
The recent price action looks like someone tried to pump it... but forgot to ventilate. 💣💨
🧻 Support is about to get wiped.
💩 MACD says momentum is going down the drain.
🚽 Volume drying up like gas after Taco Tuesday.
TA Summary:
RSI Divergence ✅
Rising wedge (aka clogged pipes) ✅
Community still in denial? ✅

ICICI Prudential Life – Turning the Corner?After months of steady decline inside a falling channel, ICICI Prudential Life is showing early signs of reversal. The stock has recently broken out of its channel with a strong bullish weekly candle, closing at ₹571.70 with a +4.5% gain. Volume is picking up, and RSI is curling up above 40 with a bullish divergence—indicating momentum is building. Price is now near a key resistance zone (~₹590–₹610); a clean breakout here could confirm trend reversal.
📊 Financial Snapshot
Net Premium Income: ₹10,169 Cr vs ₹9,465 Cr ⬆️
PAT: ₹226 Cr vs ₹221 Cr (flat YoY)
VNB Margin: Healthy at 26.7%
Embedded Value: ₹47,020 Cr
Solvency Ratio: Strong at 211%
AUM: ₹2.88 Lakh Cr
💡 Why Consider Buying?
Reversal setup after long correction
Attractive risk-reward near base
Steady premium growth, strong solvency
Long-term growth play on India’s underpenetrated life insurance sector
🚫 Risks / Why to Wait:
Resistance at ₹590–₹610 still intact
PAT growth has been flat
Sector sentiment can be sensitive to interest rate trends
🎯 Trade Setup:
Buy Zone: ₹565–575
Target 1: ₹610
Target 2: ₹660
Stop Loss: ₹540
for educational purposes only

RSI 101: Revealing the Special Characteristics of RSIWhy does RSI have support and resistance levels at 40 and 60?
Why does divergence happen between RSI and price?
What is RSI momentum?
All the characteristics of RSI (that I know) will be explained here.
Formula and Meaning
If you are using TradingView, you probably already know what RSI is and what "overbought" and "oversold" mean. So, I won’t repeat it here. Instead, I’ll dive deeper into the true nature of RSI, giving you a different perspective.
You can skip the mathematical formula of RSI, it’s already discussed everywhere online. Just remember this ratio table:
Here’s how I explain the table:
At RSI = 50, the average gain equals the average loss (I'll call this the buy/sell ratio). This is a balanced point. Buyers and sellers are equally strong.
At RSI ~ 60 (66.66), the buy/sell ratio = 2/1. Buyers are twice as strong as sellers.
At RSI ~ 40 (33.33), the buy/sell ratio = 1/2. Sellers are twice as strong as buyers.
At RSI = 80, the buy/sell ratio = 4/1. Buyers are four times stronger.
At RSI = 20, the buy/sell ratio = 1/4. Sellers are four times stronger.
The formula shows that when RSI reaches 80 or 20, the buyer or seller is extremely strong — about four times stronger — confirming a clear trend.
At these levels, some Trading strategies suggest placing a Sell or Buy based on the overbought/oversold idea.
But for me, that’s not the best way. The right approach is: when a trend is clearly formed, we should follow it.
I'll explain why right below.
Look at this chart showing RSI changes with the buy/sell ratio:
When RSI > 50:
When RSI < 50:
You can see that the higher RSI goes, the slower it climbs, but the high buy/sell ratio makes price move up faster.
Similarly, when RSI goes lower, it drops slower but price drops faster.
That’s why at overbought (RSI=80) or oversold (RSI=20) areas, you need to be careful. Even a small RSI moving can lead to big price changes, easily hitting your stop loss.
On the other hand, if you follow the trend and wait for RSI to pull back, you will trade safer and more profitably.
RSI Key Levels
Here are some special RSI levels I personally find useful when observing FX:XAUUSD :
(These levels are relative. They might vary with different timeframes or trading pairs. Check historical data to find the right ones for you. On bigger timeframes like M15 or above, the accuracy is better.)
RSI = 20
When RSI hits 20, sellers dominate. This confirms a trend reversal to bearish.
RSI = 80
When RSI hits 80, buyers dominate. This confirms a trend reversal to bullish.
RSI = 40
This is a sensitive level. Sellers start gaining the upper hand (sell/buy = 2/1).
If buyers lose 40, they lose their advantage.
So RSI >= 40 is "buyer territory". In an uptrend, RSI usually stays above 40.
RSI = 40 acts as support in an uptrend.
RSI = 60
Same idea. RSI <= 60 is "seller territory".
RSI = 60 acts as resistance in a downtrend.
40 and 60 are considered the key levels of RSI.
Now you guys know why RSI has support/resistance around 40/60!
RSI Range
As you know, RSI moves between 0 and 100.
Since RSI >= 40 is buyer territory, we can see the relationship between price and RSI:
When RSI stays above 40, price tends to move in an uptrend:
When RSI stays below 60, price tends to move in a downtrend:
When RSI stays between 40 and 60, buyers and sellers are balanced, and price moves sideways in a box:
When RSI is moving, It creates a RSI Range.
Whenever the trend switches between the three states — uptrend, sideways, and downtrend — a Range Shift is formed.
At first, RSI moves in 40-60 range, price moves sideways. A strong price move pushes RSI to 80. Later, RSI stays above 50, helping price grow strongly. When momentum fades, RSI returns to 40-60 and price moves sideways again.
Note:
RSI reflects Dow Theory by showing the stages of accumulation, growth, and distribution.
And as you see, when RSI touches key levels, the trend often pulls it back.
RSI Momentum
Price momentum means how fast price changes.RSI momentum represents the change in the strength between buying and selling forces.
When RSI > 50:
If price falls, RSI shows high momentum — RSI drops fast but price drops slowly.
If price rises, RSI shows low momentum — RSI rises slowly but price rises fast.
For example, at first RSI is above 50.
Price drops from (a) to (b) by 44 units, RSI drops from (Ra) to (Rb) by 25 units.
Later, RSI drops from (Rb) to (Rc) (also 25 units) but price drops from (b) to (c) by 73 units.
When RSI < 50:
If price falls, RSI has low momentum — RSI drops slowly but price falls fast.
If price rises, RSI has high momentum — RSI rises fast but price rises slowly.
RSI and Price Divergence
Divergence happens when price and RSI move in opposite directions:
Price goes up but RSI goes down, or vice versa.
Why does divergence happen?
In a strong downtrend, price forms a bottom at point (1), and RSI drops to level (r1).
When a price pullback happens, price pushes up to a peak at point (2), and RSI also bounces back to level (r2).
Because the downtrend is strong, after completing the pullback (1-2), price continues to make a lower bottom at point (3).
At this point, remember the behavior of RSI momentum when RSI is below 50:
It takes a large price drop (from 2 to 3) to cause a small RSI drop (from r2 to r3).
Meanwhile, even a small price increase (from 1 to 2) causes a large RSI rise (from r1 to r2).
Since the distance (1-2) is smaller than (2-3), but the RSI move (r1-r2) is bigger than (r2-r3), divergence is created.
Divergence shows that the current trend is very strong, not a complete signal of a trend reversal.
(I might share with you how to spot a complete RSI reversal signal in future posts.)
As shown in the example above, after forming bottom (5) and creating a bullish divergence between (3-5) and (r3-r5), price still kept dropping sharply while RSI kept rising.
In these areas, if you keep trying to catch a reversal just based on divergence, you will likely need to DCA or cut your losses many times.
That’s why the most important thing in trading is always to follow the trend.
RSI Exhaustion
RSI Exhaustion happens when RSI keeps getting rejected by a resistance or support zone and can’t break through.
After a strong downtrend, RSI recovers but stalls around the 5x zone.
It tries many times but fails, showing buying power is weakening.
Then the downtrend continues:
Exhaustion near high or low RSI levels creates stronger divergences than exhaustion in the middle range:
Double or triple tops/bottoms on RSI (M or W shapes) basically indicate RSI exhaustion.
RSI Can Identify Trend Strength
In an uptrend:
If RSI pulls back to a higher level before going up again, the trend is stronger.
The pullback should not fall too deep (below 40).
Example:
First rally: RSI drops to 60 before rising again → strong rally (273 units).
Second rally: RSI drops to 50 before rising again → weaker rally (94 units).
Same idea for a downtrend:
If RSI pullbacks to 50 then drops again, the downtrend is stronger than if it pullbacks to 60.
RSI Support and Resistance
Besides 40-60 acting as support/resistance, RSI also reacts to old tops and bottoms it created.
Why does this happen?
RSI is calculated from closing prices.
On a higher timeframe, the candle close price is a high/low or support/resistance price on lower timeframes.
When RSI moves in a trend on a higher timeframe, it maintains a buy/sell ratio, forcing lower timeframe RSI to oscillate within a range.
Example:
On H4, RSI stays above 40 → uptrend.
It makes H1 RSI move between 30-80.
Sharp RSI tops/bottoms react even stronger because they show strong buying/selling forces.
Summary
When looking at the price chart, we can see that price can rise or fall freely without any defined boundaries.
However, RSI operates differently: it always moves within a fixed range from 0 to 100.
During its movement, RSI forms specific patterns that reflect the behavior of price.
Because RSI has a clear boundary, identifying its characteristics and rules becomes easier compared to analyzing pure price action.
By studying RSI patterns, we can make better assumptions and predict future price trends with higher accuracy.
I have shared with you the core characteristics of RSI, summarized as follows:
Besides overbought (80) and oversold (20), RSI respects 40 and 60.
40 is support level in an uptrend. 60 is resistance level in a downtrend.
In an uptrend, RSI stays above 40.
In a downtrend, RSI stays below 60.
An RSI Range-Shift leads to a trend change.
RSI Divergence shows strong trends.
Double or triple tops/bottoms show RSI exhaustion → potential reversals.
The higher the RSI level, the slower it moves, but the faster the price rises.
The lower the RSI level, the slower it moves, but the faster the price falls.
A strong uptrend can be identified when RSI moves within a higher range or shows continuous bearish divergences.
A strong downtrend can be identified when RSI moves within a lower range or shows continuous bullish divergences.
RSI reacts to its old tops and bottoms.
Sharper RSI peaks show stronger selling.
Sharper RSI bottoms show stronger buying.
In the next parts, I’ll show you how to apply these RSI's Characteristics to trend analysis, multi-timeframe analysis, and trading strategies, that you might have never seen before.
I trade purely with RSI. Follow me for deep dives into RSI-based technical analysis and discussions!

Massive bullish divergence on BTCUSD 1D chartThe is a massive bullish divergence on the BTCUSD 1D chart.

RSI 101: Scalping Strategy with RSI DivergenceFX:XAUUSD
I'm an intraday trader, so I use the H1 timeframe to identify the main trend and the M5 timeframe for entry confirmation.
How to Determine the Trend
To determine the trend on a specific timeframe, I rely on one or more of the following factors:
1. Market Structure
We can determine the trend by analyzing price structure:
Uptrend: Identified when the market consistently forms higher highs and higher lows. This means price reaches new highs in successive cycles.
Downtrend: Identified when the market consistently forms lower highs and lower lows. Price gradually declines over time.
2. Moving Average
I typically use the EMA200 as the moving average to determine the trend. If price stays above the EMA200 and the EMA200 is sloping upwards, it's considered an uptrend. Conversely, if price is below the EMA200 and it’s sloping downwards, it signals a downtrend.
3. RSI
I'm almost use RSI in my trading system. RSI can also indicate the phase of the market:
If RSI in the 40–80 range, it's considered an uptrend.
If RSI in 20 -60 range, it's considered a downtrend.
In addition, the WMA45 of the RSI gives us additional trend confirmation:
Uptrend: WMA45 slopes upward or remains above the 50 level.
Downtrend: WMA45 slopes downward or stays below the 50 level.
Trading Strategy
With this RSI divergence trading strategy, we first identify the trend on the H1 timeframe:
Here, we can see that the H1 timeframe shows clear signs of a new uptrend:
Price is above the EMA200.
RSI is above 50.
WMA45 of RSI is sloping upward.
To confirm entries, move to the M5 timeframe and look for bullish RSI divergence, which aligns with the higher timeframe (H1) trend.
RSI Divergence, in case you're unfamiliar, happens when:
Price forms a higher high while RSI forms a lower high, or
Price forms a lower low while RSI forms a higher low.
RSI divergence is more reliable when the higher timeframe trend remains intact (as per the methods above), indicating that it’s only a pullback in the bigger trend, and we’re expecting the smaller timeframe to reverse back in line with the main trend.
Stop-loss:
Set your stop-loss 20–30 pips beyond the M5 swing high/low.
Or if H1 ends its uptrend and reverses.
Take-profit:
At a minimum 1R (risk:reward).
Or when M5 ends its trend.
You can take partial profits to optimize your gains:
Take partial profit at 1R.
Another part when M5 ends its trend.
The final part when H1 ends its trend.
My trading system is entirely based on RSI, feel free to follow me for technical analysis and discussions using RSI.

GOLD - Day Trading with RSI 04/03/2025FX:XAUUSD
Daily Timeframe (D1): Still in a strong uptrend, with RSI and both moving averages are pointing upwards. The WMA45 is above 60.
4-Hour Timeframe (H4): RSI is positioned between the resistance created by WMA45 (current price around 3152) and the RSI 60 support level (current price around 3121).
1-Hour Timeframe (H1): The WMA45 is trending upward, supporting the bullish trend.
Trading Plan: BUY
Entry Zone:
When the RSI on the M15 timeframe is supported at the 50 or 60 levels.
Entry Confirmation:
When M5 completes a wave, or a divergence appears.
Or even when M1 shows divergence.
Stop Loss:
20–30 pips below the M5 low.
Take Profit:
100 pips or R:R ≥ 1:1.
Or when M5 completes its own uptrend.
But be careful when RSI on H4 reaches its own WMA45.
You can check out the indicators I use here: tradingview.com/u/dangtunglam14/

GOLD - Day Trading with RSI 04/02/2025
Weekly and Daily Timeframes (W & D):
GOLD is still in an uptrend, as the RSI's WMA45 is still hovering near the 70 level, and RSI remains above both of its moving averages.
H4 Timeframe:
This timeframe is currently showing a correction. However, it's not yet considered a downtrend because the WMA45 is still in the high region, close to the 70 level. But, RSI has dropped below the WMA45.
At present, the RSI on H4 is facing dynamic resistance from the WMA45 above and has support around the 4x level (43-48). The corresponding temporary price levels are approximately 3128 (resistance) and 3088 (support).
This end-of-uptrend correction on H4 could lead to high price volatility. GOLD may move within a 300–400 pip range (between the resistance from WMA45 and the RSI support around the 4x zone).
H1 Timeframe:
Currently in a downtrend, as RSI is moving below both of its MAs, and the WMA45 has a noticeable downward slope.
H1 also has RSI support at the 30 level (temporary price ~3086) and resistance at WMA45 above (temporary price ~3130).
Since we’re focusing on intraday trading, priority is given to the H1 trend.
Figure 1
Trading Plan: SELL
Entry Zone:
When RSI on M15 approaches upper resistance: levels 50–55 or 65–70.
Confirm Entry:
Conservative/Safe approach: when M5 ends its uptrend and reverses (see example in Figure 1 – M5 ends uptrend when RSI crosses below both MAs).
Or when bearish divergence appears on M5.
Or even earlier, when there’s divergence on M1 and M5's WMA45 flattens out.
Stoploss:
20–30 pips above M5’s recent peak.
Or if RSI on M5/M15 breaks through its previous high.
Take Profit:
100 pips or R:R >= 1:1.
Or when M5’s downtrend ends (when RSI crosses above both MAs).
You can check out the indicators I use here: www.tradingview.com

GOLD - Day Trading with RSI 04/01/2025FOREXCOM:XAUUSD
D and H4 Timeframes:
GOLD is in a strong uptrend.
RSI is operating around the 80 level, indicating that buying pressure is 4 times stronger than selling pressure.
Priority: Trade in the direction of the trend on higher timeframes.
H1 Timeframe:
GOLD is showing signs of a correction: EMA9 has crossed below WMA45, and RSI is positioned below the two MA lines.
Given the current slope of WMA45 on the H4 RSI, this correction is considered minor for now.
Intraday Trading Plan:
Entry Strategy:
If H1 continues to correct: Look for buy entries when RSI H1 reaches previous RSI lows (zones 44, 55).
If H1 breaks the current high (level 3128): Look for buy entries when RSI M15 reaches previous RSI lows (zones 30–40).
At these levels, RSI M5 should end its downward wave (e.g., forming a double-bottom pattern on RSI) or show a price-RSI divergence before entering a buy trade.
Stop Loss (SL):
Set SL 20–30 pips below the entry point's low on the M5 timeframe.
Take Profit (TP):
Follow an R:R ratio of at least 1:1.
Or, take profit when M5 ends its bullish wave:
If RSI M5 forms a double-top pattern or
If RSI M5 crosses below WMA45.
Partial profit-taking is recommended at different stages to optimize returns.
📌 Refer to my scripts for pre-configured RSI indicators. 🚀

Who knows ?SUZB3 is in an uptrend channel on the monthly chart, specifically at the lower edge of this channel, in a region that would indicate a buy, however, at this position on the 2-hour chart it presents a head and shoulders pattern at the end of a downtrend line. Meanwhile, the RSI shows divergence indicating a reversal to an uptrend.

#FARTCOINUSDT is showing bullish momentum📈LONG BYBIT:FARTCOINUSDT.P from $0.3590
🛡 Stop Loss: $0.3465
🕒 Timeframe: 1H
⚡️ Overview:
➡️ BYBIT:FARTCOINUSDT.P is showing bullish momentum on the 1-hour timeframe.
➡️ The price has recently broken through the resistance zone at $0.3590, which could serve as an entry point for a long position.
➡️ The chart shows an accumulation zone in the $0.3374–$0.3590 range, where volumes (visible on the volume profile to the left) indicate strong buyer interest.
➡️ The POC (Point of Control) is at $0.3462, confirming support below the current price.
➡️ The price is maintaining an uptrend structure: higher lows and highs are forming, and the breakout at $0.3590 is accompanied by increasing volumes, signaling bullish activity.
➡️ The #RSI (14) indicator on the 1H timeframe is at 65, indicating bullish momentum without being overbought, leaving room for further growth.
🚀 Plan:
➡️ Entry: Buy above $0.3590 after the 1-hour candle closes above this level to confirm the breakout.
➡️ Stop Loss: Set at $0.3465 (below the support zone and POC), which provides a 3.5% risk from the entry point and protects against false breakouts.
➡️ Risk/Reward Ratio: From 1:2 (for TP1) to 1:5.5 (for TP3), making this trade attractive from a risk management perspective.
🎯 Take Profit Targets:
💎 TP1: $0.3660
(nearest resistance level, +1.9% from entry)
💎 TP2: $0.3730
(zone of previous highs, +3.9%)
💎 TP3: $0.3790
(key growth target, +5.6%)
📢 A price consolidation above $0.3590 with sustained volume increases the likelihood of reaching the targets. The $0.3660 and $0.3730 levels may act as profit-taking zones, so monitor price action in these areas.
📢 Risks: If the price drops below $0.3465, it could signal a false breakout and a return to the consolidation zone of $0.3374–$0.3465. In this case, consider reassessing the position.
📢 Market Context: The rise of BYBIT:FARTCOINUSDT.P may be supported by the overall positive sentiment in the crypto market. As of March 19, 2025, BYBIT:BTCUSDT.P is trading steadily above $90,000, creating a favorable backdrop for altcoins.
BYBIT:FARTCOINUSDT.P is showing strength and potential for growth on the 1H timeframe. A confirmed breakout above $0.3590 is your signal to act! We expect a move toward the $0.3660–$0.3790 levels.

Bitcoin’s Monthly RSI Nearing Danger Zone – Time to Sell?The chart above illustrates Bitcoin’s price action alongside the Relative Strength Index (RSI) on a monthly timeframe, which helps identify overbought and oversold conditions. Historically, Bitcoin’s major bull cycle peaks in 2013, 2017, and 2021 coincided with the monthly RSI reaching between 85-95, as highlighted by the blue circles. A downward trendline connects these peaks, suggesting that each cycle has seen slightly lower RSI highs, indicating a potential long-term momentum decline.
Currently, the RSI is approaching this historical resistance zone, signaling that Bitcoin may be nearing its market peak. If this trend continues, it could mark the final phase of the bull run, making it a strategic period for profit-taking. Traders should closely monitor RSI behavior, as a rejection from this level could indicate the start of a correction.
Historically, a monthly RSI of 85-95 has been a strong sell signal, marking the end of Bitcoin’s bull markets. If Bitcoin follows this pattern again, a distribution phase followed by a downturn could be expected.


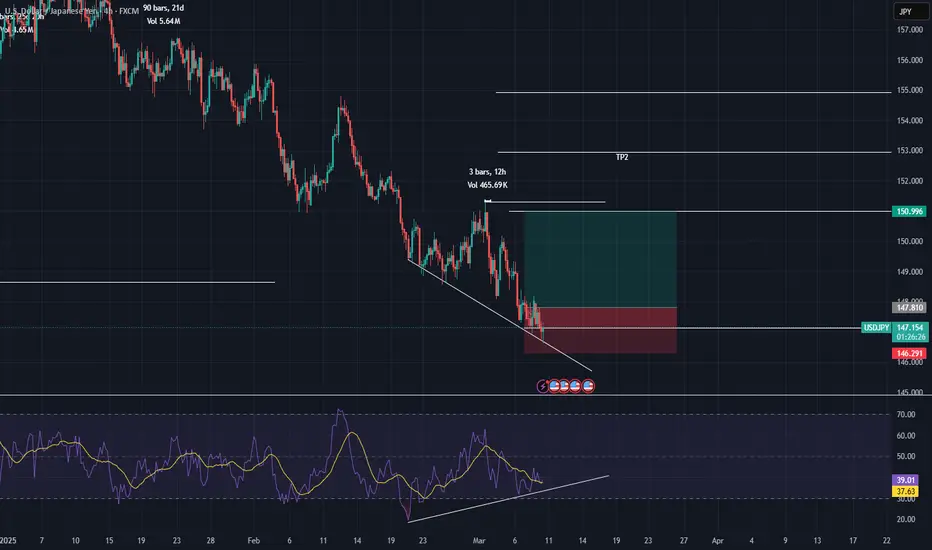
USDJPYI don't usually trade using the RSI strategy, but for some reason, I decided to take a look at it. What I found was a very strong divergence on the 4-hour timeframe, which has been developing over 72 candles—a significant number. Based on this, I expect this candle to be the reversal candle signaling an upward move toward the targets mentioned above.
Trade safely
Will the EUR/USD recover? - Is the Stock Market on the verge...In this market preview, I go over the EUR/USD, GBP/USD & USD/JPY with the primary focus on the EUR/USD. Will it recover or give out and test lower lows...
Also, ETF's that I am watching and keeping an eye on a potential bearish tone for the stock market.
I also share a small update on Crypto trade MATIC.
As always, good luck and trade safe.

BTC Potential Drop to $72K: 3 Signs Indicating a Trend BreatherBitcoin has been on an incredible run, but I believe we may be heading for a pullback toward $72K. There are three key signs that suggest a breather is due:
Double Top Formation – We've seen a clear double top pattern forming, signaling a potential reversal.
RSI Divergence – The RSI is showing divergence from price action, often a sign that the momentum is weakening.
Overbought Conditions – Bitcoin has been in overbought territory for a while now, suggesting that a correction could be on the horizon.
Keep an eye on these factors as they could play a big role in where BTC goes next. Stay cautious and be prepared for potential volatility.
I hope you find it helpful!
Take care and keep it shiny.
Kina ♥
