ADAUSDTHello Dear friends
happy new year :D
On the daily time frame, we have the positive divergence of the RSI, which has strengthened the possibility of forming a bearish wedge pattern at the end of the bearish trend.
The current trend is likely to continue up to the $0.23 range. In case of breaking the downward trend line and maintaining the support range of $0.19, we can expect the formation of an increasing trend up to the specified limits.
We would be happy to hear your comments
Rsidivergence

USDJPY - Bullish SharkYou know my bullish bias on USDJPY with this Bullish Shark Pattern retest with RSI Divergence is a great setup for that.

#Audio #short #setupHello Padawans,
I'm looking for those levels to get a successful short, I will enter by market orders if audio reaches these levels and if it's more weaker.
Manage your risk and consider this as quick scalps.
PS: I'm not a financial advisor
Cheers
May the force be with you!

EURUSD Alert: RSI Divergence and Upcoming Rate DecisionsThe EURUSD has been on an upward trajectory for quite some time now, but the recent price action on the 4-hour chart has raised some concerns. A RSI divergence has been observed, which is usually a bearish signal. As a result, caution is advised for traders who are currently holding long positions in the pair.
The upcoming rate decisions from both the Federal Reserve and the European Central Bank are likely to have a significant impact on the EURUSD. The FED is expected to raise interest rates by 25 basis points, while the ECB is expected to raise rates by 50 basis points. These rate hikes will have a direct impact on the strength of the US dollar and the euro, respectively.
It's important to keep a close eye on the trendline and support levels that have been drawn up on the chart. If the price of the EURUSD bounces off the support level, it could indicate a continuation of the uptrend. However, if the price breaks below the support level, it could lead to further downside.
In conclusion, the EURUSD is facing some uncertainty in the short term due to the upcoming rate decisions and the bearish signal on the 4-hour chart. Traders should stay vigilant and closely monitor the trendline and support levels to make informed trading decisions. With the FED expected to raise rates by 25 basis points and the ECB expected to raise rates by 50 basis points, the next few days could be critical for the EURUSD. Good luck traders!
Check out my previous post "Breaking Down The FX Market: What You Need To Know" for a comprehensive video analysis.

HOW IT WORKS: RSI (Relative Strength Index) IndicatorThe RSI is a popular momentum indicator used in technical analysis. It was originally developed by a mechanical engineer turned technical analyst J. Welles Wilder Jr.
It was first published in a 1978 book, “New Concepts in Technical Trading Systems” and in Commodities Magazine (Futures magazine) in June’s 1978 issue.
Today the RSI is one of the most popular indicators used to measure the speed and change of price movements.
In other words, it measures the strength of its trend direction (up, down and sideways) on any market by monitoring the changes in its closing price.
THE MAKE UP
The RSI is a line graph that moves between two extremes…
On the vertical axis (Y-Axis) the RSI line moves up and down in a range between 0 and 100.
NOTE: As the indicator is between a range, it is considered a closed indicator.
On the horizontal axis (X-Axis), the RSI line moves to the right which is plotted as time.
NOTE: You can choose your own time frame i.e. days, hours, minutes etc…
For all you technical boffins…
If you want to know how the RSI is calculated, I’ve saved this at the end of the article.
As a trader you won’t need to worry about the maths at all.
Three trading signals you’ll use with the RSI
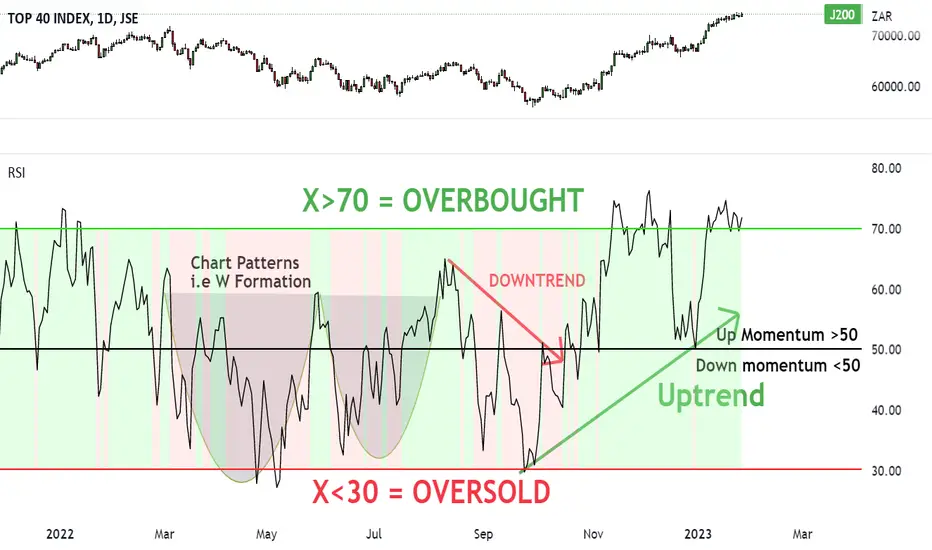
1. Overbought and Oversold levels
2. Patterns and Trend lines
3. Bullish and Bearish Divergences
Trading signal 1:
Overbought and Oversold levels
When we see the market’s price move up, this means the buyers are outweighing the sellers.
And the more higher closing prices we see, on a market, the higher the RSI line moves…
When we see the market’s price drop, this means the sellers outweigh the buyers.
And the more lower closing prices we see, on a given market, the lower the RSI line moves…
However…
If the buying continues at an unsustainable rate, the RSI will reach a point that traders call OVERBOUGHT (top heavy).
This is where we could start to expect the price to drop from these levels and for the market to enter into a correction (dip).
If the selling volume continues at an unsustainable rate, the RSI will reach a point that traders call OVERSOLD (undervalued).
This is where we could start to expect the price to turn up from these levels and for the market to enter into a recovery (upside).
Now that you understand overbought and oversold terms, let’s explain what I mean with the RSI chart.
Overbought RSI: 70 (Sell opportunity)
When you see the RSI line touch or cross above 70 (Red horizontal line), this is considered an overbought situation.
At this point, traders may start to anticipate that the rising trend is about to end.
Traders may then start to prepare to sell and short their positions, as they believe the market’s price has run up too much.
If the market then turns down and starts to drop in price, the RSI line will drop below 70 and head back to equilibrium at 50 (Black horizontal line).
Oversold RSI: 30 (Buy opportunity)
When you see the RSI line touch or cross below 30 (Green horizontal line), this is considered an oversold situation.
At this point, traders may start to anticipate that the falling trend is about to end.
Traders may then start to buy (go long) their positions, as they believe the market’s price has dropped too much.
If the market then turns up from the 30 mark and starts to rise in price, the RSI line will move back to equilibrium at 50 (Black horizontal line).
Trading signal #2:
Trend lines & Patterns
The second way to spot buying and selling trade ideas is with trend lines and patterns.
Uptrend confirmation
To confirm the strength of the market’s uptrend, you should be able to draw a support (floor level) under the high low RSI prices.
And when the RSI breaks below the support line, it could signal the end of the uptrend and a start to the next bear market.
Downtrend confirmation
To confirm the strength of the market’s downtrend, you should be able to draw a resistance (ceiling level) over the lower RSI high prices.
And when the RSI breaks above the resistance line, it could signal the end of the downtrend and a start to the next bull market.
These are great confirmation and reversal trading signals to use with your strategy.
NOTE: You can also base your buy or sell ideas on trading chart patterns…
Trading signal #3:
Bullish & Bearish Divergence
The third signal I use to spot trade opportunities with the RSI is looking at the market’s price VERSUS the RSI’s direction.
In short…
BEARISH DIVERGENCE – Warning for downside
If the markets price makes higher lows, while the RSI makes lower highs – it’s a warning for DOWNSIDE to come.
BULLISH DIVERGENCE – Sign for upside
If the markets price makes lower highs, while the RSI makes higher lows – it’s a signal for UPSIDE to come.
Either way with both bullish and bearish divergences, the RSI fails to accept the current market’s price movements.
And so it is making a probability prediction that soon the market will make a reversal in its current trend.
Ok so now you know how the RSI works. Let’s sum up what we learnt.
RSI Summary in 3 Trading Signs:
Trading signal #1:
Overbought & Oversold levels
Overbought zone X > 70 = Selling opportunity
Neutral zone: X = 50
Oversold zone X < 30 = Buying opportunity
Trading signal #2:
Trend lines & Chart patterns
Uptrend confirmation: RSI makes higher lows (draw support line)
Downtrend confirmation: RSI makes lower highs (draw resistance line)
Breakout confirmation: RSI breaks out of a chart pattern
Trading signal #3:
Bullish & Bearish Divergence
Bullish divergence: Market’s price – lower highs
RSI – higher lows
Bearish divergence: Market’s price – higher lows
RSI – lower highs
Here’s how to calculate the RSI
The most common (default) settings for the RSI is 14 (Which we’ll use))
There is a two-part calculation with the RSI.
Part 1: Calculate the RSI (step 1)
RS or Relative Strength is (Average Gain ÷ Average Loss)
Average Gain = (Sum of gains over the past 14 periods) ÷ 14
Average Goss = (Sum of losses over the past 14 periods) ÷14
Calculate the RSI (Step 1)
Part 2: Calculate the RSI (Step 2)
Once you have this result, we then smoothen the RSI result with part 2…
And so that’s how the RSI continues with each closing price of the time frame you choose.
Trade well, live free.
Timon
(Financial trader since 2003)
BTCUSD Daily overview on bearishness signsBTCUSD reached supply as it touched the Anchored VWAP at the 2022 high (@alphatrends insight), rejected the 23,000 price area after rising to 23,062 USD, which could be seen as a bull trap and a false breakout of the mother of all trendlines from ATH. This strong resistance combines the major trendline and the VWAP with a neckline of the 2021 bottom. Price action broke this dynamic trendline on June 13, 22 and tested it on August 15, 22; yesterday tested it and failed to break once again.
From the point of view of chart pattern analysis, we can consider a massive and complex Head and Shoulders formation in the retracement phase up to the neckline, which can be considered as a partial validation signal, which can arouse more interest on the bear side. Key level for new short positions. If we double down on the head range, we might see a confluence with a Fibonacci retracement from the low of Friday-13-Mar'20 for the ATH, which the 88.6% level calls the 11.4k.
Also, from a technical analysis point of view, we have a rare case of bearish divergence on this daily chart, on the RSI (not shown on this chart, but below), OBV, CCI and Chaikin Money Flow and Chaikin Oscillators.
Awesome Oscillator analysis on H4:
Ehlers Smoothed Stochastic
plus Sctochastic Divergence
H1 chart:
Looking closely, if the price loses local support on a pullback in the regression channel, it is possible that we will see a pullback at least to the breakeven level in the 19k-18k range soon, for a correction of the imbalance. Price action may react positively as bulls identify this area as a buy zone. The lower deviation of the Regression Channel calls the 14k sublevel. Therefore, I see a high possibility that the price will hit the demand zone at 16k sub-levels in a corrective wave. On the other hand, if price holds 17k making a higher low, a sharp pullback could send the price action into a large contraction (triangle) formation.
Intraday Triangle:
Looking to the daily chart of TOTAL top 125 crypto-coins market cap we can see that the price pulled back to test the upper trendline of a bearish pennant:
Psychologically, I think long-term buy-and-hold institutions may have an interest in voluntarily distributing this high level to spot traders so they can buy cheaper. Therefore, any pullback in the area of interest will be massively used by moonbois to inject liquidity. We are at a key point where market sentiment could turn from neutral to bearish. And the best choice, IMO, is to get ahead in short positions. But the scenario can only materialize with the definitions from the opening of the US Stock markets and a reversal from DXY. Mainly, I should keep an eye on S&P500 ES futures.
This is merely a technical analysis to improve studies of hypothetical scenarios and not a financial advice.
Best regards,
Thiago Oliveira
@firmestudio

BTCUSDTThe long-term downtrend line of the RSI has broken upwards on the weekly time frame. Do you think this trend can be considered a pullback to the broken level with a positive divergence?
Do you think we should react to the midline of the long-term descending channel from here?
Of course, there is still a high probability of seeing the $13,000 range, but what if we have an advance and again a downward trend!?!?
We would be happy to hear your comments

Oceanusdt local shortThe OCEAN price formed a RSI and MACD divergence at 8h tf and RSI is located at overbought zone.
Also there are a MOM and OBV divergences.
All of them go over to longer timeframes.
It could bring the price to 0.2 level.

APEUSDTHello dear friends
On the daily time frame, the positive divergence of the RSI with the downtrend line has created a bearish wedge pattern for us. Until the $5.584 range is fully consumed, the bullish outlook is weak.
But if the range of $2.618 is maintained, we can hope for the completion of the wedge pattern.
On lower timeframes, the drawn bearish scenario is very likely. However, if the range of $2.618 is maintained, the possibility of a bullish scenario will also be strengthened.
We would be happy to hear your comments

ETHBTCHello dear friends
In the four-hour time frame, positive RSI divergence is associated with butterfly and bat harmonic patterns.
Considering that the support range of $0.06552 has been maintained in the previous correction process, the possibility of seeing the lower areas is currently weak.
As long as the range of $0.070026 is maintained, we expect the formation of an increasing trend similar to the drawn scenario.
We would be happy to hear your comments

YINN China Leveraged 3x Bull Setting Up Reversal ShortYINN the China Bull EFT has uptrended dramatically of late however
it is far extended above its moving averages while the RSI indicator shows
decreasing strength as a divergence. Price rise is hitting the resistance of
the POC line of the intermediate-term volume profile where sellers will
step in and invoke selling pressure in a triple top making the resistance strong.
I expect it to drop now and perhaps dramatically,. Inversely the YANG
ETF, a bearish leveraged fund will rise. By a Fibonacci analysis, a 15%
drop is expected before another inflection. Accordingly, I would set
up a stop loss of 3-5% on the short swing trade setup .

EURUSD - Short again 1/5/2023RSI DIVERGENCE: is still valid (look left)
- Higher High price but Lower High RSI .
- RSI: a point is must at overbought (70)
- RSI: b point is important > must crossunder 50 >> mean to enough make a reversal.
- RSI: c point < 70 (undes overbought).
CORRECTIVE WAVE WAS BROKEN:
- Swing Low (Lower Low) for Profit.

Stochastic + RSI + MACD zero cross strategy from backtest on SPYStrategy
1. Stochastic cross at 50 level
2. RSI cross at 50 level
3. MACD cross at 0 level
4. Engulfing Candlestick?
5. Level 2 Tape sentiment balance (Optional)
Technical Analysis
It's a simple technical analysis setup strategy for bullish or bearish trading setup in both bullish and bearish sentiment scenarios. All levels in the indicators are at standard default settings.
Step One:
Look at the Stochastic indicator cross at 50 level and a cross over the signal line. This will be the first check and we want the cross to occur at the 50 level.
Step Two:
Check the RSI and need a cross at 50 level. This is the second confirmation.
Step Three:
Check the MACD cross and it's best to wait for the cross to happen at the zero line. This has a lower instances from occurring but it helps to avoid fake-outs that MACD is prone to showing.
Step Four:
Look for an engulfing candlestick pattern in the chart for a final confirmation.
Step Five (Optional):
If you have access to Level II quotes and the Time&Sales, watch for a momentum into the Ask side for a bullish sentiment or the Bid side for a bearish sentiment. Also you'll need to be familiar with tape reading on the volume and speed for better entry or exit.

RSI - Positive DivergenceRSI Positive Divergence in hourly chart indicates that Nifty can regain 18690

BTC - Im Bearish TA: Elliott impulse wave (12345) - Elliott correction waves (ABC) - Falling Wedge Pattern - RSI in weakly time frame is still bearish . I can't see any bullish market structure
Macroeconomics: EUR problems bcz of Russia inflation - covid-19

Dow Jones Index Outlook 21 Dec 2022TVC:DJI DJI is clearly moving in a downtrend direction in the 30m timeframe. However, it stopped making a lower low yesterday plus it has a bullish divergence signal between price and RSI.
This bullish divergence is signaling a chance of trend change to either a sideway or uptrend direction, which we need to monitor the price action today.
If the market opens within the range of 32650-33040, then it has a chance of trading in this range for today.
However, if the market chooses to gap open above 33040 then it will test at 33163 and 333000 respectively.
On the other hand, if the market gap opens below 32650 then it will test at 32470 and 32328 respectively

GBPUSDHello Dear friends
In higher time frames, we are in an ascending channel. But in the lower time frames we have a bearish signal.
If the current trend is below the range of $1.22296, the possibility of continuation of the downward trend to the green range is strengthened.
We would be happy to hear your comments

EUR/USD Corrective ShortAfter last weeks FED and ECB markets were left adjusting to Powell and Lagarde's comments.
FED will have to continue on with rate hikes well into Q2 '23 when they can start a pivot of no hikes, but certainly not making any cuts either. Rates will be held until they feel they have things 'under control'.
While Lagarde sounded 'hawkish' it doesn't change high inflation is here to stay and global growth concerns are starting to take headlines, weighing on sentiment.
I scalped the range last week but focused on shorts after fibonacci extension target was reached at 1.07350. I took short from 1.07250 closing at the end of the week at 1.06050.
This week I took entry short back at that same level, 1.06050
**If SL gets hit, it’s only 10 pips and I’ll hop in on a long scalp into 1.06500 - 1.06800
Market can range with end of year low volume so its best to cut it quick when you know a key level is failing and get in at a better entry.
At the end of the day, trade you own levels..but I hope you found to be decent

VOLTAS in the buying ZoneVoltas is forming divergence, however not as strong as desired. But it gives a good buying opportunity for positional trades here. I will buy 25% of my intended investment for Voltas here and keep buying if new lows and divergences found. But, I wont buy and just hold what I have bought if it moves up from here.
There is no stop loss, as I will keep averaging for another 75% and then hold.
One year target at least 20-30%
Will keep updating !!!

EURUSD - Trendline BreakThis was the trendline I was talking about on the chart link below. A break and close below this trendline would be the most aggressive setup for traders looking for a counter-trend trading setup.
For me, it's it depends. I will observe how the candlestick close, and sometimes I will wait for the retest of the trendline before heading in for a shorting opportunity.

Murderous Intent on GBPAUDI have a murderous intent on the GBPAUD, it is not because of revenge trade, heck, I don't even have any recent losing trades, and I've been trading for some time so I don't do that, but that is because I spotted something that many traders have missed out.
RSI Divergence on both the Daily Chart and 1-hourly chart. To top it up, on the Weekly Chart, the GBPAUD is on the Key Resistance Level.
As usual, there are a few ways to engage the trade, but I'm waiting for the candlestick pattern to retest 1.8214 for a shorting opportunity, so that it gives me a better Profit Factor.

AUDUSD - The Devil's TouchSince the analysis is unchanged, I won't be posting on the daily chart; check the link below and see how nicely the candlestick "respected" The Devil's Finger as it reversed on the trendline once touching it. That is the primary engagement method I will execute in my trade plan.
On the lower timeframe trading setup, you can wait for a break and close below 0.6673 for a breakout trading setup; you have to be aware there are a few road bumps along the road(bearish move) 0.6637, 0.6583. etc. If you shift stops to entry too early, your trade will close out without profits.

EURUSD-Weekly Market Analysis-Dec22,Wk3EURUSD is on a Bullish Trend. However, I am waiting for a counter-trend trading approach. I've two ways of engaging the trade.
The first way is to wait for candlestick confirmation and take the trade based on the Weekly Chart's Key Resistance Level in combination with a Bearish Crab Patterns trading setup, a more aggressive approach is to wait for a break and close below the trendline on the 4-hourly chart to engage the trade. So let me know if you need the analysis on this.
