GBPUSD-Weekly Market Analysis-Aug22,Wk2 A retest of 1.2026 on the 1hourly chart, not only it would give us a retest or to some a double bottom with an RSI Divergence, if you look at the bigger timeframe, the daily chart, you would see a potential Head and Shoulders Pattern that give an opportunity to long on this counter-trend trading setup.
Rsidivergence

HSY Facing Technical HeadwindsNoticing some bearish divergence on the RSI. HSY of late seems to be trading in a shape that resembles both an ascending triangle and/or a rising wedge. Due to my inability to tell which pattern it is trading in, I will remain neutral on Hershey at the moment. However, the stock has seen quite a run-up in price (since Covid), so HSY holders now may be an optimal time to trim some of this position as market fundamentals and macro risks are looking increasingly problematic.

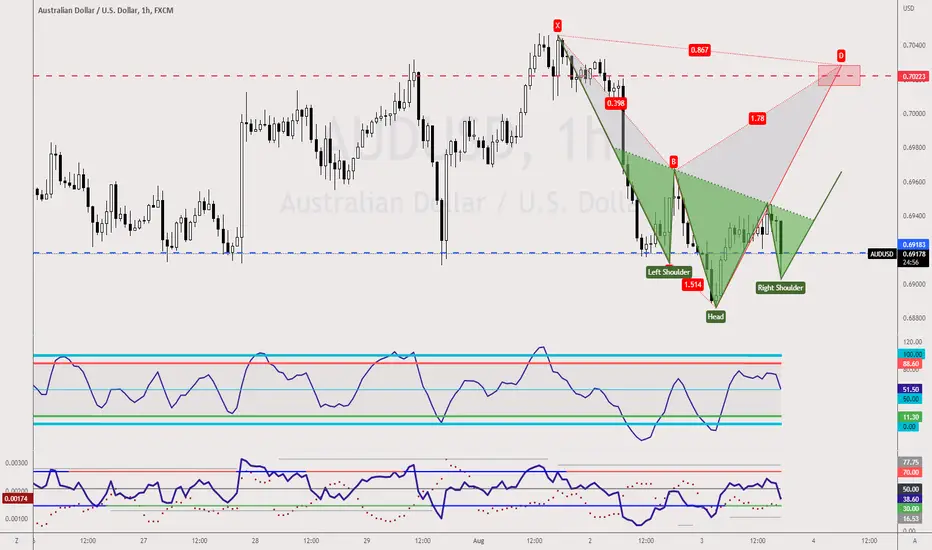
AUDUSD - Head and ShouldersA potential Head and Shoulders formation may form on the AUDUSD 1-hourly chart. What are you waiting for? Well, I'm waiting for the candlestick close to decide if it is for me.
Multi timeframe analysis - TITANLet's understand multi timeframe analysis for NSE:TITAN .
Weekly TF -
NSE:TITAN has been trading in a falling wedge pattern (LH-LL) and has recently re-tested a major demand zone. A bullish engulfing candlestick has been formed. There's an additional confluence of Harmonic Cypher PRZ around 1880.
Daily TF -
Bullish RSI divergence has been seen on daily TF. Price gaped up and did a breakout from a falling wedge structure. Short term bullish entry can be taken if price retraces back to 2080 level which was acting as a resistance earlier.

5PAISA - Short term bullish reversalLet's understand multi timeframe analysis for NSE:5PAISA .
1. Price has forming bullish harmonic bat pattern and is currently standing at a PRZ(Price Reversal Zone).
2. Price is approaching a key demand level in weekly and monthly timeframe.
3. After making a consecutive LH-LL structure, price has finally made a HL which could suggest a reversal of a trend.
4. On a daily timeframe, 14 period RSI is forming a bullish divergence.
Above confluences suggests that there's a high probability of short term bullish reversal if price succeed in breaking the previous high.

DYDX/USDT : Correction is must before the next leg upBINANCE:DYDXUSDT
Hello everyone 😃
Before we start to discuss, I'll be so glad if you share your opinion on this post's comment section and hit the like button if you enjoyed it!
Our Last call on $DYDX has been got stop-hunted and today we'll enter positions based on invalidation and hold triggers only.
Currently, $DYDX has formed an ascending channel, And based on the data we have, There's a bearish divergence formed from 29th July to 1st August.
Also, it could be a good entry zone to locate Longs towards the higher bearish base, As $DYDX has formed a bullish order-block below at $2.00
So, In terms of using both scenarios;
- There's a Short opportunity to $2.20 with an invalidation as hold above $2.84.
With a local Long position with an entry zone from $2.30 to $2.10 with an invalidation as hold below $2.00.
- There's also an aggressive Long setup after getting the invalidation above $2.84 with the Same stop-loss below $2.00.
You can have your bullish run from the current market price or lower, But you have to manage the Risk/Reward Ratio too!
Hope you enjoyed the content I created, You can support us with your likes and comments!
Attention: this isn't financial advice we are just trying to help people with their vision.
Have a good day!
@Helical_Trades

DOCKUSDTHi dear friends
In your opinion, the possibility of forming a head and shoulder pattern is not reversed!?!
On the daily time frame, it has reached an important range, we have a positive divergence of the RSI, the bulls have consumed the ranges nicely in the uptrend.
The possibility of a reaction in the yellow range of $0.01592 is very high. By observing the specified loss limit, there is a possibility of forming an upward trend up to the white range ($0.02756).
We would be very happy to hear your comments

SKLUSDTHello my dear friends
At the end of the descending channel, a tight movement is formed in the daily time frame!
The possibility of the price exiting from compression is both upward and downward.
But whichever way it exits, it will definitely be a very fast move (:
For me, it would be better to wait and enter the trade if the trend moves above $0.0616.
----> At the end of the trend, both ICHIMOKU and RSI issued a signal of formation of an uptrend.
It would be great if you share your thoughts with us.

GBPAUD Drop For Buying?Interesting to see GBPAUD D1 chart. We've been at ranging market for couple months. I spot divergence which are shown not only by MACD but RSI as well. Possibly it is indicating buy opportunity around the blue rectangle zone. Then the take profit target is the green rectangle zone.
Trade well and wisely. 🙏🙏🙏

EURJPY - Bullish SharkA Bullish Shark Pattern has checkback and retest. It seems like a busy Monday for Japanese Yen traders.

USOIL - Bearish analysis & lessonG'day all, hope you're well!
I don't usually publish my ideas, but I thought this might be worth a look since I've been experimenting with the effects of EMAs and Fibs on charts in what I like to call "Order of Priority". So, let's dig in. Before you read on, you hereby acknowledge that you will possibly be exposed to crappy chart jokes that may or may not include some form of innuendo and will likely be dad level, as well as a long-winded explanation.
There are a few things happening in this chart that point to a short term downside target or at least $80/barrel - possibly lower.
The first is the obvious giant 'W' pattern whose target was suspiciously met to within a buck or 2. The way I measured it is by running a Fib retracement from the last high prior to the W to the first wick after the lowest wick - I did this to find the .618 (dotted line Fib retracement on the left). I ignored the major drop as it was an anomaly. The wick after it lined up with the previous market bottom which made more technical sense. The .618 lines up perfectly with the 'W' neckline, so now we have a beginning and end point for a measured move - from the .618 down to the legitimate wick. Move that line upward and you have your target that met with scary precision. W patterns usually retrace to the neckline which is usually a .5 Fib after the move plays out, which lines up with the .618 Fib that we used to find the neckline. If it retraces lower, it's usually a speedy move to the .618 before becoming range-bound at around the .5. I've found this to be pretty typical of 'W' patterns in general.
Secondly, we have the RSI and MACD indicators looking all depressed. A solid bearish divergence on the RSI and a downticking MACD, like 2 emo teenagers fighting over a black tshirt. In my experience, bearish divergences don't tend to reset until they first hit oversold territory, and there's a bit of a way to go before that happens. That distance in the RSI from the current position to oversold lines up nicely with a price movement to the $64 - $70 zone, assuming there's a quick buy-up. The MACD usually doesn't confirm a reset for the next move up until it falls below the median line and crosses upward again with conviction. Conviction is key here, it can't be a half-assed cross over like those 2 emo kids.
Thirdly, we have the EMAs. The values I use are Fib values: 9 (blue), 13 (purple), 21 (red), 55 (yellow), 200 (Sasha Grey), 600 (light grey). There's a nifty rule I found works great after major moves:
* If after a major move the price falls below the 9 EMA and fails to get back above on retest, we're going to the 21 EMA.
* If the price falls through the 21 EMA and fails to get back above on retest, we're going to the 55 EMA.
* If the price falls through the 55 EMA and fails to get back above on retest, we're going to the 200 EMA.
* You get the point, same for the 600 EMA.
Right now, it's failed to get back above the 21 EMA on retest. Guess what the next target is? Now here's the kicker, if it falls through the 55 EMA, the 200 EMA is waiting for the price right at the neckline of the W pattern, with the 600 EMA resting right on the 0.5 Fib retracement when measured from the major low to the major high (dotted line Fib retracement on the right). Coincidence? Who knows.
"OK smartass, so what happens when we fall through ALL the EMAs then?" I hear you ask. First, don't be a wickhead. There's an order to these things. Everything has its own gravity in the charts, which is why I described everything above in that order. What has the most gravity, I believe, is the .618. That's at around $46 - $49. If the price falls through all the EMAs, that is the next major safe target. I say safe because of risk level. Sure, it could wick as low as the thick blue support trend line, but price will generally equalise at the .618 over time and it's generally where buy orders fill when these EMAs are broken. Placing any below there is an idea, but they're less likely to fill.
"Damn it Shifty, why didn't you just call the .618 instead of wasting our time with your crap about colourful lines and levels that sound like pasta?". Well, because each of those steps has it's own trading opportunities, particularly the EMA rule. On a lower timeframe, the trades in the EMA zones alone when you reference the weekly are gorgeous.
I hope this is helpful to someone out there who could play around with these concepts on other charts. I have other rules that I've come up with to do with Fibs and EMAs, so if you liked this crappy dad-joke of a lesson, let me know in the comments and I might go into more stuff down the line :)
Stay safe all and happy trading!

ASCENDING TRIANGLEInteresting accumulating area that could end up being an ascending triangle bullish pattern if price closes above 307 resistance level, suggesting a long with 1.8 R/R.
Bullish divergence is also seen.

EURUSD - SellsFX:EURUSD
EURUSD - Looking like we are coming for these lows to grab liquidity! Watch out

GBPAUD - Bullish BatA Bullish Bat setup is here for sideway, counter-trend, and harmonic pattern traders.
Two things to note, the market has not retraced to 1.7366 to validate the setup and Point C touches Point A candle body, which always bothers me.
Despite of that, what I like about this setup is its profit factor and the RSI Divergence.

BTC AnalysisHi everyone this is my first ldea here and to be clear I have 0 knowledge in crypto analysis but I'm developing some indicator any use it in trading like " Ultimate RSI With Some Spices " indicator
-- I thinks that we have to break up the golden line here if we want to see BTC UP , but if we don't like the red line we'll back down another time this is simple I think , you can find the indicator in my account .

Chainlink bearish divergence?Can this really be true? I have a hard time believing that chainlaink would crash to these levels, but a head and shoulders pattern and an bearish RSI divergence give somewhat clear indications of such.
BB on weekly "short term" gives hope but just a little.

USDJPY-Weekly Market Analysis-Jul22,Wk4USDJPY is on a strong Bullish Trend. However, counter-trend traders can wait for a retest at 139.11 to engage a shorting opportunity based on the Bearish Crab Pattern retest at the HOP level.
A retest at the HOP level also means I'll be getting a RSI Divergence.

SUSHIUSDTI think it is very bullish, or do you have the same opinion!?!?!
If the corrective movement trend does not fall below the price range of $0.918, the possibility of forming an upward trend similar to the drawn scenario is not at all out of mind.
On the other hand, Ethereum and Bitcoin have not yet issued a signal for an upward trend!!!
As long as the loss limit is met, you can make a trade worth the risk and reward.
We would be very happy to hear your comments

4 HR SOL/USDT Bottom Is InJust wanted to post a basic beginner style chart for people to easily be able to identify with.
4 hr SOL/USDT chart shows us the RSI has made it into my buy zone and is currently making a bullish turn. We have been on following lower bollinger bands for 16 straight candles with only 6 confirmed bullish candles in this same span. Bottomed RSI, bounce near local support should cause a bounce to test historical resistance.

A counter trend EURCHF trade for 100 pipsEURCHF has fallen to all time lows.
Based on our analysis, we are seeing H4, H1, M30 and M15 oversold.
We see M15 and M30 divergence.
The stop loss is very tight as this is a counter trend.

A big move down on AUDCAD?This pair is still in a downtrend.
We are seeing the high of yesterday as a resistance.
There is a small pattern to sell.
And a big pattern to buy right at the bottom.

DYDXUSDTHi, I hope you have a lucrative day today.
Given the type of movement in the half-hour time frame, the possibility of forming a trend according to the drawn scenario is not far from the mind!
We are happy to share your comments with us.

EURUSD-Weekly Market Analysis-Jul22,Wk1EURUSD is on its Bearish Trend, counter-trend traders could wait for further confirmation to engage the trade. There's a RSI Divergence that could give a little more peace of mind. Nevertheless, have a good risk management.
