#BTC / $BTCDescending Channel Formation in 4H timeframe..!!
RSI Bullish Divergence Still in Play..📈
In Case of Bounce Back from here, Bitcoin Might Retest the 38.8k Resistance.
Rsidivergence

Things are coming to a head! BTCWe have several patterns converging to this one area. Bullish RSI Divergence on the 4H. PA at horizontal support bouncing inside a large 25% ascending channel. Which way do we go???

KUCOIN (APE): End Of A Bearish TendencyIt seems that the bearish momentum Apecoin is having is losing its momentum, and at any time will reverse. The falling wedge pattern and the divergence also help determine a tendency reversal. KUCOIN:APEUSDT

2 Signs Ethereum's Bearish Tendency Will RevertFor a pretty long time, Ethereum has been in a bearish tendency, but, because of these signs, it will probably revert. The first one is that it is diverging. The RSI is going up despite Ethereum dropping, meaning there is a chance it will revert at any time. The second one is that it's testing the 50 EMA line. Moving Averages with high numbers (50,200, etc) normally show a market's tendency, but, because Ethereum is testing one of those numbers, it potentially means a warning that it will reverse.
CRYPTOCAP:ETH

USDJPY-Weekly Market Analysis-May22,Wk1As early as 14Oct2021, I've said that the USD is going to appreciate for the year 2022. That doesn't mean that you can't head in for any counter-trend move, you just have to do it with caution.
At 131.57, USDJPY will have an AB=CD completion, it is common for traders to look for a countertrend move at its completion.
Conservative traders could wait for a Double Top with RSI Divergence at the level. Trend Traders could wait for the Bullish Shark Pattern at the 4-hourly chart.

GBPUSD-Weekly Market Analysis-May22,Wk1If you compare the Daily Chart of both GBPUSD and EURUSD you would find that they have a very different trading setup.
On the GBPUSD, we have an ABCD Pattern as a counter-trend trading setup. Conservative traders could wait for a pullback to recent support at 1.2447 for a buying opportunity.

$SRM - falling wedge + rsi bullish divergenceSRM printed a bullish rsi divergence on 4h timeframe
I'm waiting for a breakout from the falling wedge pattern to enter a LONG trade targeting at least a 8/9% gain
what do yall think about this one?

BTC - HOURLY - NICE RECOVERY...VERY S HORT TERM ANALYSIS (HOURLY)
Today, we are going to look carefulLy what happened after the validation of the RSI bullish divergence coupled with the double top formation which i mentioned yesterday morning in my previous analysis as a warning ... (see related idea below)
So as you can see, after this validation signal the BTC moved quickly up in a new intraday bull trend, (higher highs and higher lows, confirmed with a convergence on the RSI indicator; please also note the bullish engulfing pattern at the bottom of the chart, which also added value to this nice recovery; note also the successive long white candle which broke at each time important resistance level, begining by the Tenkan-Sen, then the Kijun-Sen, the resistanc of the former downtrend channel and finally the clouds resistance area (39'475-39'713) which increase the upside move towards an intermediate high @ 40'375 then going to the high so far @ 40'800.
The 50% Fibonacci retracement @ 40'590 of the last downside correction (42'979 - 38'202 has also been filled), with the next 61.8% Fib ret @ 41'154, which also match the 4 hours clouds top resistance area and which should also be considered as the next important level to break in order to maintain this upside bias.
NEVERTHELESS, looking at the last couple hours price action, we can see a trend changing from UP to SIDEWAYS, with a RSI also moving in the same way !!
Therefore, this is the first warning signal to consider and respect !
Indeed, no bearish divergence has been confirmed yet, but I would strongly suggest to monitor very closely the price action over the upcoming trading hours.
CONCLUSION :
In order to maintain to come back in the former short term uptrend mood, the BTC should at least recover and hold above the former uptrend support line and make a new high (higher than the previous one @ 40'800
On the downside, an hourly closing below 40'375 (respectively former short term resistance area and now new short term support area !) would be the first warning signal calling for a downside correction towards the following levels :
S1 : 39'800
S2 : 39'500
S3 : 39'194 (VERY THIN HOURLY CLOUDS SUPPORT ZONE !)
As usual monitor and watch closely both shorter time frames (M30, M15 and M5) in putting in place alerts which will help you to detect early signal (s) of validation or invalidation of what I previously mentioned.
Do not forget, of course, to keep an eye, at the DAILY, WEEKLY and MONTHLY picture which will bring you a broad picture and which will remember you that the BTC is still under the influence of a MAJOR DOUBLE TOP FORMATION, with its trigger level @ 28'600, currently in the weekly time frame still in a secondary downtrend move and in the daily picture, still below the clouds...meaning that the countertrend recovery should only be consider, for the time being, as a TACTICAL RECOVERY ONLY IN A BROAD BEAR TREND and NOT AS A STRATEGIC REVERSAL YET.
Have a nice trading day.
IRONMAN8848 - Jean-Pierre Burki

$BTC - just a retest?BTC is currently retesting the 39K support zone
this has been a major level of support during the last days so this must be held if we dont want to enter another downtrend
yesterday's rsi divergence played out as always, bringing the price down this time
The price also fixed below the ichimoku cloud, leaving more space for a downtrend
we can open some good short positions if the 39K support is lost, but let's hope this is just a retest

GDXJ Bull FlagGDXJ is showing some nice bullish divergence in the pennant of a bull flag on the 4hr and daily RSI. Upside is 30%+ and if it breaks down below the lows of the flag it'd be time to get out.
This is obviously dependent on what Gold spot price does. So, if XAU decides to finally use that hidden bullish divergence to head to all-time highs, then gold miners are gonna feast too. Playing the odds.

Bullish Divergence in Euro FuturesBasically the same idea that I posted last week about the Bearish Divergence in $DXY but more time has passed, and it looks even more pronounced in the Euro itself.
Pick your poison: /6E, /M6E, EURUSD are all good Long candidates to play this idea. Another good option could be to short /SFX - which is the Small Exchange's US Dollar Futures contract. If you don't know about The Small Exchange, I'd highly recommend looking into their products.
community.thesmallexchange.com

That is a strong trend line!!hello everyone
Last week candle was a big red one for almost 80% of cryptocurrencies, and for the last couple of days we saw the same behavior until 12th of Apr. Since then we have been moving in a channel in between resistance level of 18.30$ & support level of 17$( it was mostly the trend line).
For now we have divergence in RSI in 4 hours ,so the price may fail to break the resistance level and go back to our support level (or trend line) or worst ....

AUD/JPY
Hey guys, we have had one of the biggest rallies in AUD/JPY ever 11 weeks of green. It is in major overbought territory on the RSI on the weekly and negative divergence on the daily with a bearish consolidation pattern and possibly a breakout to the downside which might confirm today. IF it does confirm I will enter a short position target first red line then lower to burn these over bought signals out.
pre good risk to reward options

EURUSD - Bullish Shark checkbackIf you are looking for a reliable setup for a countertrend move, we have spotted a Bullish Shark Pattern that has checked back.
If you are looking to stretch the target to the daily chart, Bearish Bat Pattern, I find that could be far-fetched for the time being, but I leave that decision to you.

🚀🚀🚀 XRP what's next? Very large VOLUMES! 🚀🚀🚀Hello everyone,
Unfortunately, we haven't seen a breakout of the trend line, what next?
There are several scenarios. I personally took a position at $ 0.69 on a LONG with a stop loss below the local low. I'm counting on another breakthrough attempt.
The main resistances are marked with a dashed green line. The close of the candle below the red line (resistance) will mark a descent to the last key position for XRP $ 0.55.
This week you can see large VOLUMES, which positively indicates a rebound in the price.
We also have divergences on the RSI. Increasingly higher, lows on the chart and decreasing ones on the indicator indicate a bearish.
Higher lows and vice versa on the RSI speak of a bullish move. So we have an unclear situation.
One thing is that we stopped at substantial support. Breaking it will create a medium-term doubletop, and then only a continuation of declines.
From the fresh news regarding the SEC vs XRP case.
Ripple took another victory over the Securities Commission.
The judge rejected another SEC request that was intentionally delaying the end of the case.
As a result, the re-introduction of XRP to the market may be faster than expected.
Comment and like,
Regards

BTC, ETH & SPX at SMA200 with hidden bullish divergenceBitcoin, Ethereum and S&P500 at SMA200 on 4h chart with hidden bullish divergence (blue dot line).
Expect a price recovery soon.
Gold with very low volatility - maybe further sideways action before new direction gets clear.
What do you think?
Drop me a nice comment if you'd like me to analyze any other cryptocurrency.
*not financial advice
do your own research before investing

Welspun- A good buying opportunityWelspun India is about to boom!!
- The MACD line is above the Signal line
- RSI is about to cross 60
- Supertread is in green
- 5 DMA is cutting 26 DMA
Most Indictors are showing good strength
**Disclaimer: Do Your Own Research**
**Our content is intended to be used and must be used for information and education purposes only. It is very important to do your own analysis before making any investment based on your own personal circumstances. You should take independent financial advice from a professional in connection with, or independently research and verify, any information that you find on our Website and wish to rely upon, whether for the purpose of making an investment decision or otherwise**

BTCUSDTMACD &RSI convergence/divergence.
What do you say; is it Legitimate?
Do you see a flag forming there?
drmikecrypto

Rising Wedge On HourlyES1! also has a rising wedge on hourly. Also a quadruple bearish divergence between price and RSI. Looking for short trade on breakdown through the bottom of the wedge.

EURUSD - AB-CD PatternWell, if you had participated in the post related to this article, congratulation, you would have earned the 1st target(32pips) and moving to our 2nd target now.
I've engaged the trade based on the AB=CD Pattern setup and the market form within the buy zone.

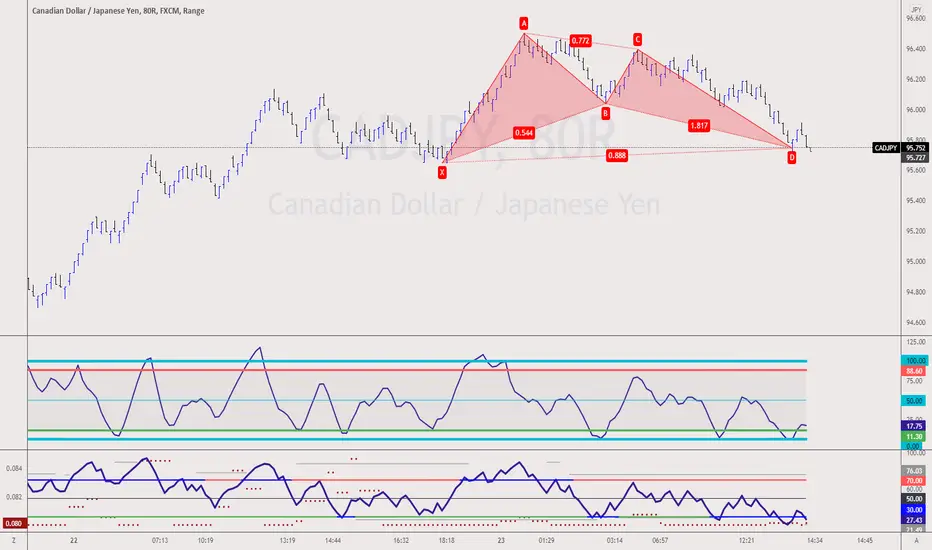
CADJPY - Bat PatternA Bullish Bat Pattern retest on the 8Range Bar. Overall the CADJPY is in a Bullish Trend. If you have plans to hop in the trend trading setup, now is the time.
AUDCAD - Bearish Shark CheckbackIf you had read my previous analysis, this is how Shark Pattern works, when the Shark Pattern hit its stop loss, it may present you another trading opportunity of a further entry price.
The problem with most trader is the hesitance to engage the trade, and I can understand that, you just got stop out. You aren't certain if this should be the trade to take.
The Shark Pattern could present as much as 3 entry price to engage the same trade. It is common that a trader can feel distraught when they get stop-out 3 times within the same trade. But once you get comfortable with the Shark Pattern, it brings you more profits and losses in the long run.
What I love about this Bearish Shark Pattern is that this is the last possibility of the Shark Pattern on this setup.
I got stung out on the previous Shark Pattern, but luckily for me the Stop-Loss is only 39pips. Well, that's possible because of my background on structure trading for the past 17years.
What about you? Are you comfortable tading the Shark Pattern?

AUDCAD - Bearish Shark checkbackA Bearish Shark retest on the AUDCAD gave me an opportunity to reverse my trade. You see, I was in a Bullish Trade(you can check out the related ideas titled AUDCAD - Bullish Bat at the bottom of the @TradingView post)
The market seems not able to close beyond Point D of the Bearish Shark Pattern on the 1hourly- chart for an extended period of time.
I've been receiving comments and DMs if AUDCAD appreciates because of Gold and Oil. Well, it is not, the AUDCAD appreciated because I've longed it! ;P
Well, jokes aside, over the years, the correlation between the currency pairs has been weakened. If you are still treating AUD like the Gold movement, you are trading like 10years ago.
I've learned that during chaotic market conditions, it is best to trade via technical analysis.
If I'm wrong about this trade, I get stopped out, and I will wait for the next trading opportunity. It's that simple.
Check out the link at the bottom for our upcoming event or invitation to our community.
