NZDJPY - Bullish ButterflyIf you had joined us last night, you would have seen how we use the Double Top Retracement zone and project a Bullish Butterfly completion that hit our final target level.
The market sort of did a rebound after it "woke up" from the ungodly hour.
Check out the live stream and you can see how the analysis was done at , you could watch from the start and learn how the zone was plotted.
www.tradingview.com
Rsidivergence

EURUSD approaching support zone.EURUSD has been trending lower for a while. It should bounce around 1.1390/1.1420 zone close to the harmonic potential reversal zone from the ABCD pattern and the extreme impulse wave. The RSI is diverging with the currency pair arguing for the exhaustion of the bearish move.

GBPAUD - 5-0 PatternA Bullish Shark Pattern has taken place on both 1-hourly and 15minutes charts of GBPAUD.
The market has reached and touched the 5-0pattern formation at 1.8358. If you like the deal to be sweetened, you can wait for the retest at 1.8366 without closing above 1.8368 for a shorting opportunity at the retest of the previous high.
Some traders would read the retest as double top, but it is not a double top.

Has BABA Finished Looking for Bottom?BABA showing a potential breakout from bullish RSI divergence while hitting a strong area of support on 1D timeframe.
I will be watching the $145 - $138 range closely for support in the coming week.
Bull Case
Expect PA to retest and find resistance at the $158 region.
A break, retest, and support of $158 would act as confirmation of likely further bullish momentum.
Bear Case
Retest and rejection at $158 could see price push below $145 - $138 support band.
A break below these levels could see PA push lower to $125 - $122 areas.
If $125 - $122 support is broken PA likely to reach ~ $100 level.
The Trade
Basis: $150.73
Stop loss: Watching for a daily close below $135 and will reevaluate then.
All areas of support and resistance on chart derived from Price action, fibonacci clusters, linear regression analysis and corresponding intersection areas of aforementioned.

GBPAUD - Bullish Butterfly checkbackA bullish butterfly pattern checks back and it retests the previous candle wick that complete the butterfly pattern with RSI Divergence.
If this is for you. a Deep Gartley Pattern and Shark Pattern formed on the daily chart for a buying opportunity.
Based on the daily chart it is a trend trading(buying) opportunity for trader.

Bearish Divergence at PCZ of Bearish Crab on Shiba InuLets see where this takes us, if we can get back below the 1.618 i suspect there will be a quick, bearish and volatile move downwards.

GBPJPY - Bearish BatIf you have engaged after this candle closed. It is a great call. And this is why you should have engaged in the trade.
1. It has reached the completion price of the Bullish Butterfly Pattern(cyan).
2. Bat Pattern consolidation at D, but fail to break and close above Point X of the Bat Pattern and that is a good sign. It attracts structure traders to hop in.
3. Long shadows appears, showing a strong rejection of the Bearish Bat Pattern.
4. RSI Divergence is a good sign of GBPJPY weakening.

Solana!!!! Bull Flag a trap ? In my recent Analysis on Solana I've published About the Bull flag formation in SOLANA
Well its our good that We are Still in profit according to that analysis but Today I have spotted a bear divergence in the RSI
So that means Solana will break in near future ?
Well Reversal can be seen in near 2 or 3 days but can not be much powerful. I also drew the Support zone which is at almost 129USDT,Most probably it can take support from there . Never the less Crypto Alts are dependent on Bitcoin only and BTC showed a massive cup and handle formation also the crypto total market cap On this basis only I am assuming bears are not powerful
However I'm eagerly waiting for your point of views fell happy to share in the comment box !
Best of luck for your trades !!

F pullback initiatedentered F 15.50p 11/12 @0.28
~We bounced off a double top
~RSI divergence like the pullback in June
~We are also seeing a similar pattern back to back
✅ Phase 1: a downtrend
✅ Phase 2 an steep upside down cup
✅ Phase 3: a nice strong uptrend impulsive move.
Using fib and zones I have PT at 15.50, 15.13, 14.60. We could see a pullback to 13.43 as well, but I probs wont hold that long. 14.60 is my last take profit, as it is the 0.5 fib line

Short 🔴 Double Bearish Wedge, RSI Crash, Bulls Will Bleed JuiceAI-generated wedges broke down.
Both retests concluded rejection.
RSI has just crashed.
Machine Learning recommends "Short" position.
Details are in the idea.
Alternative short ideas in RELATED IDEAS.

USDCAD RSI DIVERGENCE + FALLING WEDGE REVERSAL - H4 *UPDATED*Please zoom out to see my chart fully.
Highly likely reversal on USD/CAD.
This is because we can see RSI oversold divergence on the H4 chart at a key level of daily support (the black line). Price makes a lower low to the key daily support line (the black line), whilst the RSI makes a higher high, a new swing high on the RSI when the price has in fact made a new swing low - DIVERGENCE.
We also have a lovely double top pattern on the H4 chart at daily support (which is again the black line) that has failed to make a lower low.
However before I enter this trade, I want to see a H4 candle close its body above the trend line to signify a trend line break. Then I will look for long (BUY( trades on intraday timeframes.
DISCLAIMER: DO NOT TRADE THIS IDEA. IT IT NOT 100% GUARANTEED TO WIN AND YOU MAY LOSE MONEY. TRADING INVOLVES RISK.

Volume-Weighted Divergence Play on AAPL 10R via NEXT RSINEXT RSI Divergence Play: Key Concepts
- NEXT RSI is a low-lag, volume-weighted momentum oscillator that often precedes price action
- Divergence play resets at each open (do not count prior session's highs and lows)
- Use as you would other divergence strategies: higher price highs, lower NEXT RSI highs = bearish; lower price lows, higher NEXT RSI lows = bullish
-Use a preset TP / SL and/or close if NEXT RSI retraces back to last relevant high or low
Target Market:
- AAPL 10R Chart
- can be used with almost any market; volatility helps
Order Management:
- Enter on forming divergence, 2 or more clearly separated peaks or troughs
- TP / SL at 30 cents (AAPL)
- Exit if price retraces to the last NEXT RSI top or bottom referenced when opening the position
Optional:
- Additional NEXT RSI strategies can be discovered using the free companion NEXT Strategy Visualizer

ETH at Risk of dropping, RSI Divergence !!!Hello everyone, as we all know the market action discounts everything :)
_________________________________Make sure to Like and Follow if you like the idea_________________________________
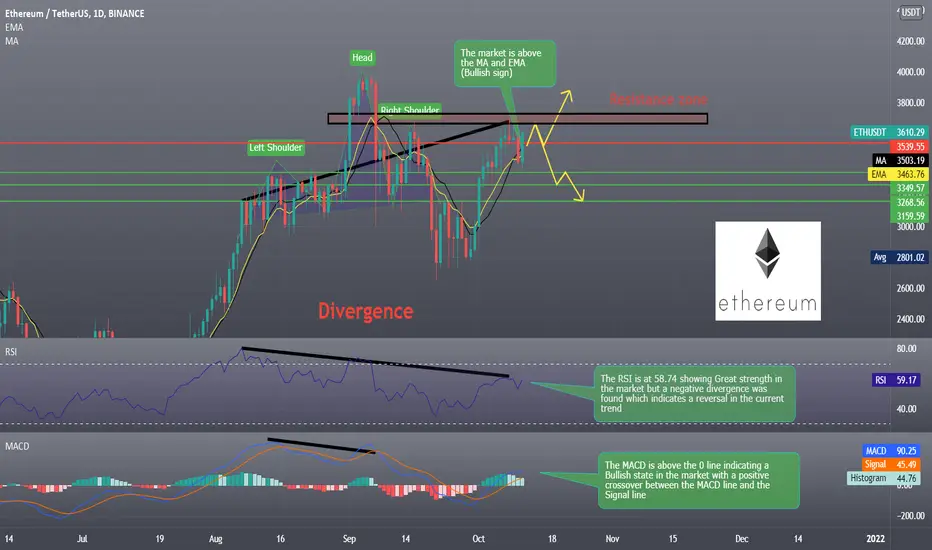
The ETH token is at risk of dropping back to the 3000$ level in the next period of time as the chart showed 2 divergences between the market and the RSI and MACD.
when the market has turned Bullish after the Head and Shoulders pattern that appeared on the chart, people took comfort that the Token price didn't drop but today we see that multiple signs are giving Bearish Signals that could indicate that the value of Eth could drop soon.
Possible Scenarios for the market :
Scenario 1 :
The market is trading at 3608.67 right now under a good Bullish movement that broke the first resistance line located at 3539.55. This move will probably push the ETH price to the Main Resistance zone where ETH might have a big problem breaking out from.
If the Bulls were to gather force and breakout that zone then we will see a push that could bring the ETH back to the $4000 level.
Scenario 2 :
A big divergence was found between the Market and different indicators that show a good possibility for a reversal soon and it will start probably near the first resistance level located at 3539.55, If the reversal turns to be True then a Bearish trend will lead the ETH price down and the first stop will be the support level located at 3349.57 and then the support at 3159.59 where we might see a big battle between the Bulls and Bears over control of the market.
Technical indicators show :
1) The market is above the 5 10 20 50 100 and 200 MA and EMA (Strong Bullish Sign)
2) The RSI is at 58.74 showing Great strength in the market but a negative divergence was found which indicates a reversal in the current trend.
3) The MACD is above the 0 line indicating a Bullish state in the market with a positive crossover between the MACD line and the Signal line, A divergence has been found between the indicator and the market
Daily Support & Resistance points :
support Resistance
1) 3349.57 1) 3539.55
2) 3284.42 2) 3664.38
3) 3159.59 3) 3729.53
Weekly Support & Resistance points :
support Resistance
1) 3341.66 1) 3737.47
2) 3109.09 2) 3900.71
3) 2945.85 3) 4133.28
Fundamental point of view :
Ethereum is certainly making strides towards the Ethereum 2.0 completion. Just a few days ago, the project announced the arrival of its Ethereum Altair upgrade. To specify, the upgrade will be taking place sometime this month.
The purpose of Ethereum 2.0’s launch is to fully deploy a Proof-of-Stake consensus onto its platform. This model should eliminate the platform’s long-striving issues of high gas fees, congestion, and limited scalability.
"It seems like Ethereum is losing Steam. As a result, companies are looking into platforms like Cardano , which is used to build dApps, and Solana, which has seen a nearly 4,800% growth since September 2020." According to FXempire
This is my personal opinion done with technical analysis of the market price and research online from Fundamental Analysts and News for The Fundamental point of view, not financial advice.
If you have any questions please ask and have a great day !!
Thank you for reading.
a bit short for bitits possible to btc's waterfall and we fall in big hole .
please be careful.
52600
50500

DOT RUNNING! - UpdateDot has broken past the local golden pocket and the final major local resistance, and is currently pressed against the top of the major golden pocket,. which tracks back from the May - July dip.
Chart Patterns:
Dot rejected the bearish head and shoulders pattern that I had previously predicted on Sept 30th.
The Head and Shoulders pattern from September could be looked at as a symmetrical triangle with a target price the length of the tail (around $44)
The technical indicators shown:
MACD - Has turned up and is bullish green, which signals to me that DOT will break farther upwards.
RSI - Shows bullish RSI divergence moving forward. Note, I have the bearish RSI Divergence marked from April - MAY which signaled the major dump. The bullish RSI divergence SHOULD be the same, but opposite, strength as what we had in May.
Fix Range Volume indicator: Shows we have broken past the volume resistance.
ITG Scalper - Shows a buy signal from about a week ago.
My strategy:
First off, I would like to note that DOT in my opinion has been manipulated HEAVILY in the last few months and should be a top 5 project.
I closed position between 38 and 36, and started looking for a buy position when DOT bounced off of the $26 mark. I entered around the $28 mark and currently holding that position.
If we bounce off of the golden pocket with force, I will close position and look to reenter around 30, or on the break upward past the golden pocket.
If we break past the top of the golden pocket, my targets are: $44, $50 (this is ATH), $62.
Currently looking for a price target at the end of the bull run $100 by December, $250 if extended.
This is not Financial Advice.

BTCUSD - D1/H4 - SIDEWAYS/UP ...Following the strong rally seen over the last couple of days (4 successive white candles) the BTCUSD
lost momentum and switch from an upside price action to a sideways price action in a narrow slightly up
orange channel (currently in a 53'500-56'500 trading range) and facing right now roughly the middle level of this ongoing sideways/up trend
channel.
Looking behind, the lagging line is also trying to attempt a breakout of its former high, not achieved yet (should be done and confirmed on a daily basis).
IMPLICATIONS :
UPSIDE - A successful upside "orange" channel breakout (daily closing !), would reopen the door for the former steeper uptrend channel putting the focus on the psychological 60'000 level
DOWNSIDE - A failure to hold in the ongoing sideways/ up channel would trigger a downside move acceleration with focus on the psychological 50'000 support level.
TS @ 49'729 - KS @ 47'870 and MBB @ 46'616
4 HOURS (H4)
Sideways, slightly up channel pretty clear !
Mid Bollinger band acting currently as the first significant support level .
Watch same levels than for D1
Intermediate support @ 52'632 and very fragile (52'250-49'830 trading range below !!!)
Last but not least, bearish divergence has been detected and current price action looks like a pullback attempt; check if a convergence will take place and neutralise this ongoing downside risk !!!
SHORTER TIME FRAMES
HOURLY H1)
Clouds support zone under attack !
Ironman8848

Axis building short position a per RSI indicator #swing trade AXIS BANK is making a short build up ... seeing a good opportunity to sell it at market price risk reward 1/3\
Thankyou hope you like NSE:AXISBANK

THETA/USDT LONG (W/ Video Analysis)This is the published idea for the analysis done in the video walkthrough HERE
Looking to trade the RSI divergence on a 4H time frame.
Keeping a tight stop loss as no confirmation of divergence has played out and I am taking the trade preemptively.
Risk of loss against portfolio has been identified and accepted.
Entry : $4.80
TP1 : $4.97 - To cover potential rejection of linear regression channel and possible stop out.
TP2 : $5.98 - Take profit in here and will reevaluate the trade.
S/L : $4.62 - A tight stop-loss here due to larger bearish indications.
Methodologies and targets explained further in depth in the video 🤙

BTC is trying to get DIVERGENCE for BULLISHI drew some divergences. all arrows followed DIVERGENT principle.
Current: some recent candles try down or fluctuate 40k->44k to form a NEW UP DIVERGENCE( RSI UP, PRICE DOWN or STRAIGHT bases on LOW PRICE -> It is building on 4H TF)
PS: I am big fan of divergence

Video Walkthrough of Analysis for THETA/USDT Wanted to give a video walkthrough of this trade to cross reference the published idea to give some perspective on my thought process for it.
To track the progress, see the link to the idea below.

EURUSD - Bullish Bat retestWe have a Bullish Bat Retest with an RSI Divergence. This is 1 of my favourite combination for an aggressive trade.
Well, I'm in for this. Not quite sure if this will be the trade for you.
Share with me why or why not you will be in this trade?

USDCAD - Bullish BatA Bullish Bat Pattern has retest at X, which is effectively retesting on the support level of the buy zone. What's nice about this retest is that there is an RSI Divergence happen on the retest.
What's comforting to know is that there is an Ascending Triangle that seems to form on the daily chart.

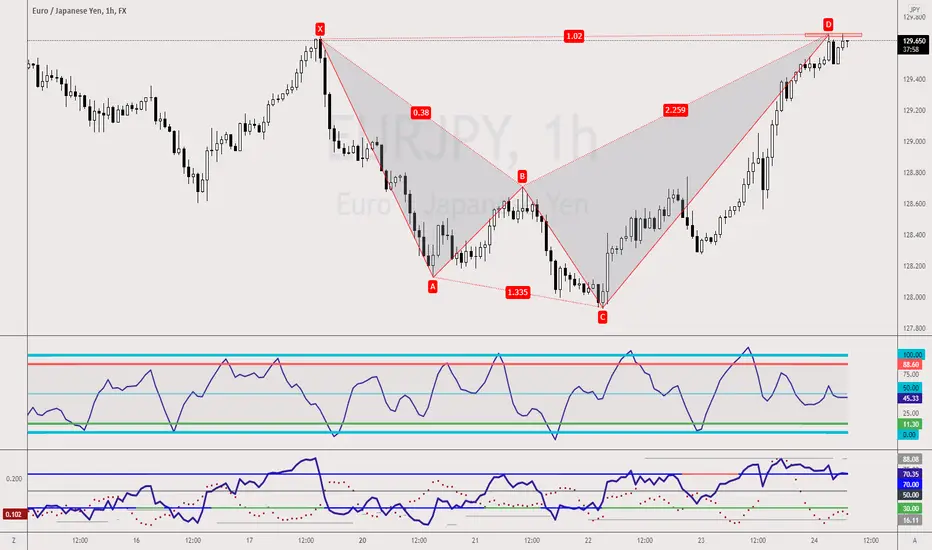
EURJPY - Bearish SharkA Bearish Shark Pattern as a countertrend trade form up on both EURJPY and GBPJPY 1-hourly chart. As we know the shark pattern can have as many as 3different entry prices, these 2 patterns only have one. And both of them has RSI Divergence. That's one thing I love about these setups.
Comparing the 2, EURJPY would be a much-preferred pair as it forms upon structure. We have also learned that cherry-picking don't do us much good. I'll engage both trading setups.
I'll include the link to the GBPJPY for your reference.