GBPAUD Possible ReversalRSI indicating Bullish Divergence so a possible reversal may show up here. Possible trap to short sellers.
Rsidivergence

ETHEREUM BEARISH RSI DIVERGENCEHello everyone
On Ethereum we got what it seemed to be an ascending triangle which is a bullish pattern. The upper line indicates the resistance line.
We could calculate the target by measuring the width of the base of the triangle and placing it at the break out point.
We broke and the price surpassed the target by a little bit.
Currenty it seems like we are forming a bull flag on the daily time frame which is a also a bullish pattern.
But from the other hand we are forming a bearish RSI divergence.
So i would be cautious trading the bull flag.
Always use a stop loss!
Thanks
*Nothing of the above is financial advice*

Nickel Sep ShortNickel Sep Short
Sell at CMP- 1424.4
SL- 1432
Target- 1413
Disclaimer- We are not SEBI registered advisor.
Charts and views are only for educational purpose.

EUR/USD Upswing Running Out of Steam?Negative RSI divergence on a test of resistance below 1.19 hints EUR/USD is losing upward momentum and may reverse lower. Looking for a close below 1.1770 to confirm.


USDJPY - 5-0 PatternConsolidation in the 5-0 Pattern is what traders who shorted the Shark Pattern don't want to see. A break and close below the blue box will ease the mind of many. However, Profession traders will look closely at that level and decide should they liquidate their 2nd Target and go long.
You don't need to stare at the screen, just set an alert and let technology alert you and decide when the candlestick close.

Solana all time high, overbought state Hello everyone, as we all know the market action discounts everything :)
_________________________________Make sure to Like and Follow if you like the idea_________________________________
Solana reached an all-time high at 103.062 breaking all of the old resistance lines, Why is this coin doing so well for itself? and what could be behind this movement?
The main reason why Solana is doing so well is that Solana has the highest per-second transaction among blockchains and the lowest transaction fees, people are realizing that by using Solana they will be saving a lot of money from transactions alone.
Solana is the fastest blockchain in the world and the fastest-growing ecosystem in crypto, with over 400 projects spanning DeFi, NFTs, Web3, and more.
Now let's look at the technical analysis and price action for this coin :
Scenario 1 :
The coin price is trading at 97.437 right now almost hitting the first resistance line at 97.710, The bulls are gaining more power by each day as the market brings more cash flow and knowing that could push the price above the resistance zone from 97.710 - 101.220 which will lead into a breakout of that zone and a further push will happen leading the price to go near the 107.454 level.
Scenario 2 :
The market has been in the overbought state for the last 2 weeks and an RSI divergence has been found which could lead to a reversal in the market, and it will start when the Bears will push the price to the first support line at 90.750 where the main battle will happen between the Bears and Bulls and the market will move according to the winner if the Bulls were to win then we will see the price push back up to the 97.710 level again, And if the Bears wins then we could expect a second drop that's going to be headed near the second support at 87.300 or even the third support at 75.924.
Technical indicators show :
1) The market is above the 5 10 20 50 100 and 200 MA and EMA (Bullish sign)
2) The RSI has been trading in the overbought zone since Aug 14, And a divergence has been found between the market and the indicator which could lead to a reversal in the trend.
3) The ADX is at 87.42 showing that the market is super trending right now, with a positive crossover between DI+ and DI-.
Support & Resistance points :
support Resistance
1) 90.750 1) 97.710
2) 87.300 2) 101.220
3) 75.924 3) 107.454
Fundamental point of view :
On Aug. 24, digital asset management firm Osprey Funds registered a first-of-its-kind Solana fund with the U.S. Securities and Exchange Commission (SEC). In doing so, the New York firm hinted at giving institutional exposure to SOL markets as the token's value surged by more than 4,300% in 2021.
A day later, real-time data feeder Pyth Network announced that it is going live on Solana's proof-of-stake blockchain. The firm provides "high-fidelity streaming data" from trading firms and exchanges, which allows it to cover global market activity without depending on any single data source.
Pyth will use Solana's cross-chain communication protocol "Wormhole" to broadcast market data with decentralized applications functioning atop Ethereum, Binance Smart Chain, and Terra blockchains. According to Cointelegraph
This is my personal opinion done with technical analysis of the market price and research online from fundamental analysts and news for The Fundamental point of view, not financial advice.
If you have any questions please ask and have a great day !!

ADA to 3.2$ wave 5Perfect hit on previous ADA setup.
Looking like we are in the last wave 5 on daily.
Fibonacci Extensions are in confluence and suggests targets are in between ~3,2$ and ~3.3$.
1H wave count looks like we are not done correcting.
Entry :
The 4H looks like a bullish falling wedge, so we can trade the breakout with an entry price around ~2.64.
Because 1H says that we have one more leg down we could wait to enter at the end of wave 5 below ~2,47. This will increase risk reward ratio.
Target :
TP 3.28$
Stop loss :
Risk reward ratio is pretty good but macro in crypto with BTC and ETH looking pretty bearish could increase risk.
Stop loss should be set below lowest low. Depending on entry price this should be 2.460 for a breakout at 2.64 and 2.37 for the 1H wave 5 entry.
Two scenarios lets see if they playout. Of course if BTC continues going down, highly unlikely because the weekend is coming, this idea will get invalidated.

AUDCAD - Bullish FlagA Bullish Flag may just form up on the AUDCAD 1-hourly chart. The 15minutes chart may provide a possibility of a 61.8% retracement after the double bottom has formed. Although with the current candlestick formation, it is unlikely for a retracement to happen, if it does it will give me a better fill.
The current entry gives you a 1.4:1 Reward:Risk, if a retracement happens, it will easily give you a 2:1.
Well, for me I engage half of my position, so when the market run without waiting for me, I still can earn some and when it retraces I can wait for candle confirmation to engage the second half.

ETH Continues to Grind up as It Diverges Bearishly.Lets see if we can get a major reversal off the 1.13 this time.

BTCUSD ShortBTCUSD
Looking short as per previous charts to levels, 37/36k USD to as low as 30,000 USD before continuing long.
D1 Divergence occuring, looking to continue short on a swing trade down to levels shown, this is an area i consider to be a good buy opportunity provided we continue upward into previous ATH or possibly new ATH, i'm unconvinced of this bearish indication and believe it to be a fakeout. i see us continuing upward to previous predicted highs of 78,000USD - 92,000 USD per Bitcoin.
D1 divergence is hidden divergence, however this hidden divergence is occuring in a downtrend which itself has formed within the overarching uptrend of bitcoins price action, this divergence is good in my eyes for a swing trade from resistance down to support where i've shown that i see the RSI and Price diverging once again, hidden divergence, however this time it will be hidden divergence forming in the overall uptrend on the W1 time frame, with a confluence of 4H, D1 & W1 divergence and support being found by bitcoin i consider this to be a strong indication that price will continue to increase, this however remains to be seen and will need to be looked at to confirm this trade long when the time is right and when/if price reaches the levels i've shown to be the target of this short trade.
Good Luck all, please feel free to chime in if you agree or disagree, but if you do please elaborate on your opinion, otherwise it isn't beneficial to anyone.

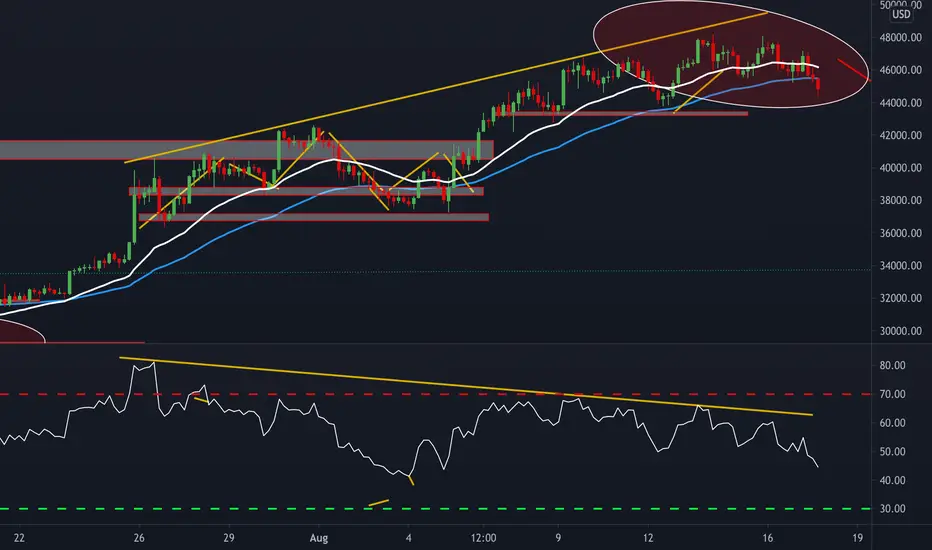
Bitcoin is going to complete ABC corrective waves up to 42KHi dear traders, It time to take decision for your positions.
Bulls are saving their profits and bears are preparing to get in slowly!
Elliot Waves Theory
As you can see according to the valid Elliot theory and after this huge bull run Bitcoin needs a correction for sure!
50K - 52K is an important Fibonacci cluster zone and is acting as a resistance.
According to this theory we must expect a 3 corrective waves which called ABC corrective waves.
RSI and PRICE Divergence
As you can see a bearish divergence can be seen on the chart which is an important sign for trend weakness and reverse probability.
Share this Idea with your friends.
Your likes and comments are the best thank you!

Apple Stock Daily Analysis, RSI & MACD Divergence Hello everyone, as we all know the market action discounts everything :)
_________________________________Make sure to Like and Follow if you like the idea_________________________________
The Apple inc Stock has been doing very well for itself in the last couple of months, Both the short-term and long-term trends are positive. This is a very positive sign.
AAPL is currently trading near its 52 week high, which is a good sign. The S&P500 Index however is also trading near new highs, which makes the performance in line with the market.
An RSI Divergence has been found between the stock and the indicator, which could indicate a drop in price for the next period of time, But knowing that the Stock is still doing very well but there are signs that the price could be dropping other than the RSI, The MACD is having a Negative crossover and a divergence but still shows that the market is Bullish, And the stock price has reached the Bollinger Bands upper end which could indicate a small drop.
Scenarios for the market :
Scenario 1 :
The market has reached the resistance level at 148.86 and now it's trending above it with no confirmation of a breakout yet, but if the Bulls keep on pushing then we will see a breakout at that level and the price will keep going up reaching the 150.58 resistance area where the Bull power will be tested by the Bears in hope to drive the price back, If the Bulls were able to prove them self then we could see the price going back to the 151.68 range which was the all-time high for this stock.
Scenario 2 :
The market is trending 149.71 and it reached the resistance level at 148.86, We did notice an RSI divergence and a Negative crossover between the MACD line and the Signal line plus a MACD divergence, And the market almost hitting the upper band in the Bollinger bands. With all of that, the market is still holding a Bullish position but these signs could affect the market and a drop will happen where the price will be headed near the support zone from 147.14 - 146.10 where the Bulls will try to win back control again.
Technical indicators show:
1) The market is above the 5 10 20 50 100 200 MA and EMA (Strong Bullish Sign)
2) The RSI is at 60.41 showing great strength in the market, with a divergence between the indicator and the market which could indicate a drop.
3) The MACD is above the 0 line showing that the market is in a Bullish state, Negative crossover between the MACD line and the Signal line. With a divergence between the indicator and the market.
4) The Bollinger Bands are showing a squeeze which could indicate that a huge move is coming soon.
Support & Resistance points :
support Resistance
1) 147.14 1) 148.86
2) 146.10 2) 149.54
3) 145.42 3) 150.58
Fundamental point of view :
AAPL's Return On Assets of 26.32% is amongst the best returns of the industry. AAPL outperforms 97% of its industry peers. The industry average Return On Assets is 1.29%. And its Profit Margin is 25.00%, The industry average is 2.10%. AAPL outperforms 97% of its industry peers.
Based on estimates for the next 5 years, AAPL will show a quite strong growth in Earnings Per Share. The EPS will grow by 12.37% on average per year.
South Korea is likely to bar Google and Apple from requiring software developers to use their payment systems, effectively stopping them from charging commissions on in-app purchases, the first such curbs on the tech giants by a major economy.
For Apple, commissions from in-app purchases are a key part of its $53.8 billion services business and are a major expense for some app developers.
This is my personal opinion done with technical analysis of the market price and research online from fundamental analysts and news for The Fundamental point of view, not financial advice.
If you have any questions please ask and have a great day !!
Thank you for reading.

TRRIPLE HOURLY CHART RSI DIVERGENCEAUROPHARMA
Bullish Above 700 for 1 Hour Close
Target 750, 780
SL: 660
Risk is yours and Reward is too yours totally.
RSI Rising as Price Falling, 3 times in row in Hourly chart..
Reversal chance

Bitcoin big drop incoming!?!?Hello Everyone,
Although I am bullish on bitcoin overall, I believe Bitcoin is going to experience a drop within the next 7-10 days. Why? Bitcoin is up 70% from the bottom, a pullback is necessary in order to continue price upwards. Personally, I had some nice profits in both my DCA and trading account so I went ahead and sold!
Here is my analysis:
1. RSI bearish divergence - we are seeing lower peaks in RSI with higher prices. This is bearish.
2. MACD weakening buying momentum.
3. Ascending wedge - this is a bearish pattern, similar to what we saw around 60k.
4. Price action - Price action is over all bearish as we are seeing volume going down as price going up.
5. Keeping with a Healthy bull market. The health of the market cannot see a straight line upwards. We need to see a sell off so we can reset and continue upwards.
6. Testing large resistance areas with low volume - Price will not clear high resistance with low volume. This is a bearish sign that a sell off is brewing. ]
7. Bitcoin broke out and alts mooned. This is a sign that things need to cool off and reset for more longer term upwards movement.
Although I believe we will see a dip in price, I do believe bitcoin is bullish in the longer term. I will be looking for entries along major support areas such as 36k , 42k , etc.
As always, use risk-management, be patient, and good luck trading!

Divergence in XLM* XLM in 1H time frame forms Expanding channel. Here the price moves between two broadening trend-lines.
* Expanding channel appears with narrow opening and broad closing like a reverse symmetrical triangle.
* A RSI divergence also appeared in XLM.
* RSI divergence occurs when there is no longer the same momentum between RSI indicator and the price.
* If the price pulls back and break the upper trend-line we can expect a rally till $0.3910. XLM is bearish below the support.

GBPJPY - Bullish BatLike GBPUSD, GBPJPY also has a Bullish Bat setup that B point hasn't touch Fibonacci Retracement 50%. Although it is a similar setup, there are 2 things that GBPJPY came to a bit short compare to its big brother GBPUSD.
1. The Friday candle close haven't touched Point D.
2. Point C touches Point A candle body.
Where we can wait for #1 to fulfil but #2 is a warning sign and the minimum candle formation you need to see is a Bullish Engulfing candle at Point D.

ADA Analysis, Cup and handle pattern, RSI divergence Hello everyone, as we all know the market action discounts everything :)
_________________________________Make sure to Like and Follow if you like the idea_________________________________
Cardano (ADA) cryptocurrency surged by over 18% to set a new all-time high of $2.57.A Big Cup & Handle pattern emerged and broke out 3 days ago which explains the coin movement, The coin is having a very good Bullish movement which could be the start of a Bullish trend.
Be careful from the Divergence that has been found between the RSI And the Market that could be a reversal sign and the price has a very good chance to drop down.
The Market does seem to be Turning Bullish with this push and we can see 2 different scenarios on how the market could move in the next few days.
Bullish Scenario :
The Coin is at 2.742346 right now, if the Bulls kept supporting this trend then we will see the market hitting the first resistance line at 2.565357, Notice with the Bulls power right now they shouldn't have any problem breaking out the first line, But the real Battle starts at the next resistance level at 2.675435 where the Bears will try to gain control back over the market and if they fail then the price will keep going up reaching the 2.771431 range.
Bearish Scenario :
We spotted a Divergence between the RSI and the Market this could be a Reversal sign and if that would to happen then the current trend will change and the price will drop down and it's going to be on its way to the first Support line at 2.359283 where the Bulls will try to retake control over the market and if they fail then we could be seeing a bigger drop and the market will be headed near the support area at 2.263287 - 2.153209.
Technical indicators showing :
1) The Market is above the 5 10 20 50 100 200 MA and EMA (Bullish sign)
2) The MACD is above the 0 line showing that the market is in a Bullish state, with a positive crossover between the MACD line and the Signal Line
3) The RSI is at 78.79 sitting in the overbought zone, With a divergence between the indicator and the market, which could be a reversal sign.
Support & Resistance points :
support Resistance
1) 2.359283 1) 2.565357
2) 2.263287 2) 2.675435
3) 2.153209 3) 2.771431
Fundamental point of view :
it seems like the “Alonzo” upgrade has a significant impact on investor sentiment. The upgrade is about smart-contract features and addresses what critics have called one of the network’s most glaring deficiencies.
For instance, smart contracts have been a revolutionary strength in the blockchain industry. This is because they have allowed the creation of Decentralized Finance protocols, non-fungible tokens (NFTs). Also, a new form of carrying out trades without the need for an agent.
Cardano (ADA) is one of the projects that have gained momentum throughout 2021. But now that the project’s long-awaited smart contract abilities are on the verge of becoming reality, the crypto is on the hill of setting new all-time highs. According to Coinquora
This is my personal opinion done with technical analysis of the market price and research online from fundamental analysts for The Fundamental point of view, not financial advice.
If you have any questions please ask and have a great day !!
Thank you for reading.

AUDCAD - Supply and Demand ZoneThis might be a great counter-trend trading opportunity for the counter-trend traders. I'm waiting for the 9pm candle close due to 8.30pm Canada CPI When I said aggressive, it's just I'll take the trade.

Ascending triangle in Filecoin* Filecoin in 4H time frame forms Ascending triangle with it's resistance near $75.5 and the below trend-line as it's support.
* The RSI divergence also appears on Filecoin, it occurs when there is no longer the same momentum between the price and the RSI indicator.
* If the price breaks either side of the pattern we can see a healthy move.

Bitcoin 2300+ In Profit SetupGood day guys! If you were able to enter into this position, you are 2300+ pips in profit. Another phenomenal call. Be sure to move your stop loss into profit. I still do see there is a lot of downside to go, however, nothing goes straight up or straight down. Well I do appreciate you for checking out our post and remember, we will see you on the other side.
Rodrick Goss (CEO)
Third Eye Traders
SPY reversal: Turning downtrendAs one can see in the chart, there is RSI divergence. This is a hint at a reversal in momentum.
After the impulsive move towards 447 we are due for a pullback. I believe we should hit some support at 446 and experience a very small rise again (not to an ATH) before we experience a pullback through the support at 446 toward the support at 443.
Once we hit support at 443 I believe we will see an impulse movement toward 446 in which we will reject it and start the downtrend where we have lower highs and lower lows. From here we may form a head and shoulders.
