BTCUSD 1h. A Series of RSI Divergences.Hi everyone,
Thank you for considering reading my idea.
In this hourly chart, we saw a series of RSI Divergences. Will we create another bullish divergence in the next 24-36 hours?
Like this idea and follow me for more analysis like this.
Cheers,
Juvs
Rsidivergence

JPPOWERBULLISH DIVERGENCE : A STOCK IS SAID TO BE IN BULLISH DIVERGENCE WHEN MOMENTUM IN RSI INDICATOR IS MORE THAN THE PRICE MOVEMENT ,AS ONE CAN SEE IN THE ABOVE CHART PRICE MOMENTUM IS IN DOWN TREND WHEREAS RSI MOMENTUM IS IN UPTREND THIS IS AN INDICATION OR SIGN OF EXTREME BULLISHNESS
I HOPE U ALL UNDERSTOOD THIS CONCEPT CLEARLY IF SO PLEASE SUPPORT BY FOLLOWING AND LIKING

Trading inside a consolidation! 😒Now the situation is getting clearer on NIO to me. I see a consolidation between the 42.34 and the 40.89.
To the side it breaks, we’ll see a good movement next.
If NIO breaks the upper line, then the 46 is the next stop. If NIO breaks downwards, then the 20ma is the target. It seems simple enough to me, but it is not over yet!
The problem is the RSI. We have a small divergence, and it is overbought. This makes me more comfortable with the idea of a downwards breakout to the 20ma. Then the RSI will cool down, and the risk-reward ratio will increase too.
If you liked this trading idea, remember to click on the “Follow” button to get more trading ideas like this, and if you agree with me, click on the “Agree” button 😉.
See you soon,
Melissa.

Good patterns above the retracements! 👍Yes, in the first candlesticks of the day Tesla closed above the 580 we talked about yesterday, and it was a powerful candle, btw! Powerful enough to create a divergence between price/rsi!
Tesla also did a bullish reaction above the fibs retracement, which is great! Now the only thing that would made me believe it’ll drop to the 540 is if it breaks the 577 again, and this will be a dead cat bounce. If not, then the 635 is the next stop for us.
If you liked this trading idea, remember to click on the “Follow” button to get more trading ideas like this, and if you agree with me, click on the “Agree” button 😉.
See you soon,
Melissa.

It did a good movement today! 😯Ok, AAPL didn’t hit the 122 as I thought, but it is looking good today!
Yes, it broke the 125.23, my original buy point, before I thought it would drop to the 122. Since the beginning I was looking carefully at this strong RSI divergence, but the bulls appeared before I expected.
Now I think any pullback will be a chance to buy, and the target is the 127.90.
We have a consolidation on AAPL, and the 127.90 is the next stop for us. The RSI is interesting here too, and perhaps we’ll break the 20ma for good. If AAPL drops again, it’ll be a chance to buy.
If you liked this trading idea, remember to click on the “Follow” button to get more trading ideas like this, and if you agree with me, click on the “Agree” button 😉.
See you soon,
Melissa.


Going to the $ 122? 🤔Ok, the RSI divergence persists, but AAPL is not giving any buy sign yet. Remember, we trade price, not indicators!
At any moment it could break the 125, and today, it lost the support around 124.
In the 4h chart we are heading to the 122, which is the place we’ll buy AAPL, to sell at 127.90, with a tight stop-loss. The more it drops, better the risk-reward ratio gets. But as I’ve been saying, probably we’ll see another chance to trade next week.
If you liked this trading idea, remember to click on the “Follow” button to get more trading ideas like this, and if you agree with me, click on the “Agree” button 😉.
See you soon,
Melissa.


BANK NIFTYIn WEEKLY time frame it has activated a Bullish Hidden RSI Divergence
In DAILY time frame it has activated a Bullish Sea Horse Pattern
These suggest levels of 36000/37000 as possible targets.
View gets negated below 32500

Several patterns around! Which one will prevail? 👀The Nasdaq did a double top pattern today, and a strong RSI divergence, and this made the index drop again to the 13,600, the base of the range it is in.
Now, there’s a chance that it will break the 13,700 for good and hit the ATH: It must break the 13,695, as this is a pivot point + 20ma resistance.
On the other hand, we have a possible bearish scenario in the 4h chart:
The 13,700 is a good resistance for the index, and today we had a pretty big candlestick that could dictate the next steps for the tech stocks.
If the index loses the 13,602, then probably it’ll keep correcting, maybe to the 13,400 again.
So, we have a few points and strategies to use here, despite the complexity of the moment. This week might be boring, but I believe next week we’ll see some intresting stuff around.
If you liked this trading idea, remember to click on the “Follow” button to get more trading ideas like this, and if you agree with me, click on the “Agree” button 😉.
See you soon,
Melissa.

Follow ETHUSDT potential bullish signal!After trend breakout, wait the bearish correction, retest structure and long! RSI divergence too

A virtually perfect trade. GL to those who are still in!Ok guys, our trade on TSLA was virtually perfect (technically speaking). You'll find the links to our last 2 analysis, when I pointed the trigger point (Friday) and the analysis we studied on Monday, if you need more details.
But I'll summarize for you. First, Tesla broke the 592, the trigger point, and we had the confirmation of an advanced breakout on the RSI as well.
Tesla did trigger the trade, and it did the pullback to the 596 as we also discussed in our last analysis, giving another chance for the late traders to buy Tesla.
Today, it hit the target we mentioned on Friday, the 626.
Tesla has more upside in the 4h chart, as it is not overbought at all, but since it just hit our target, I think it is time to book profits. It was a perfect trade, and I'll just wait for another opportunity. Also, we have a divergence on the RSI in the 30min chart, so, I don't want to take any chances here anymore. I'll hold a just a small position here, and quit most of it.
I'll keep you guys updated about Tesla.
If you liked this trading idea, remember to click on the “Follow” button to get more trading ideas like this, and if you agree with me, click on the “Agree” button 😉.
See you soon,
Melissa.

EUR/USD to mark a top with Rising Wedge breakout?EUR/USD looks to be completing a bearish Rising Wedge on the 8-hour chart. Negative RSI divergence reinforces. Confirmation eyed on a close below 1.2171.

Hidden Divergence on supportEURUSD just printed a hidden divergence on a support area.
Overall the currency is in a bullish trend so I think a long position here is possible.

AUDCAD - Bullish ButterflyA Bullish Butterfly with RSI Divergence can be a pretty good counter-trend setup for harmonic pattern traders.
I've engaged the trade as this is a type2 of Butterfly Pattern. If this is a profitable trade, you should see some profit at 10pm(+8GMT)

NZDJPY - Bullish Butterfly PatternA Bullish Butterfly Pattern is about to emerge, I'm waiting for the candle to touch 77.91 and retraces for a valid pattern. But for some Harmonic Pattern trader would have treated this as a Type 2 trade as the candle circled in yellow is close enough to them. It misses the completion by a pip. I'm not going to argue on that as every trader can have their own trading rules and they have their own trading decision to make. I'll still wait for the candle confirmation at 77.91.

gbpNzd Short 4Hthe bearish divergence in the pair is occuring at an area of interest. Hoping to catch the move down shortly/ Trade safe. Not a financial advise

Could it break the 592? The chart says yes!TSLA is about to break the 592, the point that could create a rally to the 626. The RSI has a very strong divergence, but we must wait for the confirmation on the price.
What's more, the divergence is also seen in the 4h chart. Tesla entered the support area, and it is doing some good patterns now. It also seems we have an advanced breakout. But again, there's nothing for us to do, but wait for the breakout! The price will tell us what to do, in the right time.
If you liked this trading idea, remember to click on the “Follow” button to get more trading ideas like this, and if you agree with me, click on the “Agree” button 😉.
See you soon,
Melissa.

It hit our target! But, what to do now?Ok, now we are losing momentum, and AAPL is getting weaker, and that's absolutely normal. We did a fantastic trade, but now it seem it is time for AAPL to rest a little. We'll see another entry point when the charts normalize. The RSI also tells us that AAPL is overbought.
But even considering a possible correction ahead, let's keep in mind that the bias is bullish.
We have an advamced breakout on the RSI, indicating that the price might follow this movement next. I'll keep my belief that if it breaks the 127.90 it'll seek the 131 next. In the end, it is overbought in the 30min, but still has some potential in the 4h chart. This means some possible correction in the short term, which would give opportunity to buy, aiming the 131 in the mid term. This seems to be a nice strategy for now, let's see if we'll follow it!
If you liked this trading idea, remember to click on the “Follow” button to get more trading ideas like this, and if you agree with me, click on the “Agree” button 😉.
See you soon,
Melissa.

Moving according to the plan! What should we do now?As we expected, PLTR did a lateral movement today. We identified this thanks to the RSI divergence, but right now we have some hopes that PLTR will do something good next.
We nailed the purple area, and right now it has a chance to hit it again. We have an advanced breakout on the RSI, and if PLTR breaks the 20.80 it'll confirm our bullish idea.
The 4h chart shows how strong the purple area is, as it was a previous top at 22, and it is the 61.8% fibs retracement. If PLTR breaks this resistance, the 24 is the next stop for us. Let's watch the 20.80 in the 30min chart, as this will be our lead.
If you liked this trading idea, remember to click on the “Follow” button to get more trading ideas like this, and if you agree with me, click on the “Agree” button 😉.
See you soon,
Melissa.

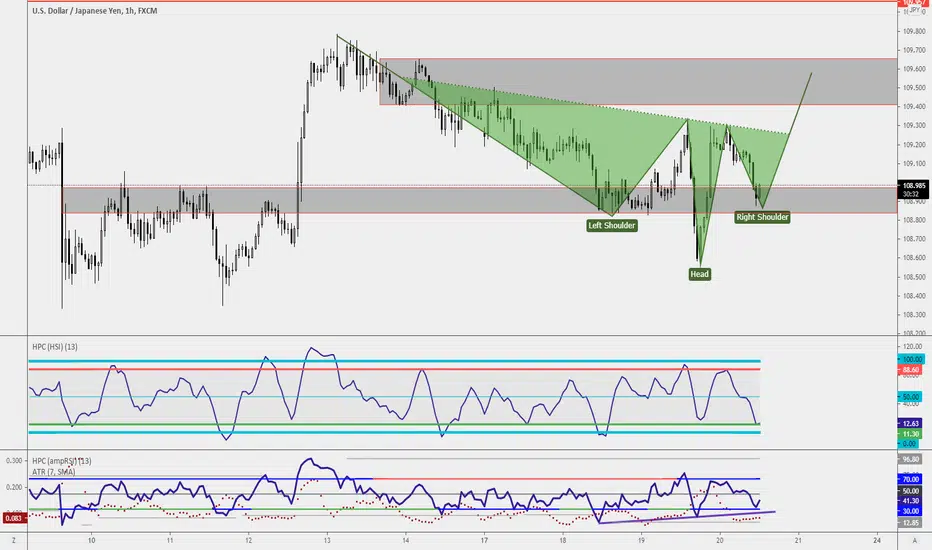
USDJPY - Head and Shoulders formationHead and Shoulders formation with RSI Divergence, within the 13:00-14:00 candle close, it should show a bullish candle. If that doesn't happen, do reconsider your trade.
Going on a date with short-seller / Match.com I strongly believe in the company over the long term but for now i see the following
1. Income H&S
2. Exiting quarantine! people for some time will let go of phones cause they got sick of them but eventually they will return to the easiness of online-dating (cost effective/ time effective / psychologically easiness, people want to avoid pain at any cost)
3. RSI Divergence

Good risk-reward on Nasdaq!We have a good pattern on Nasdaq 100 today. In the 4h chart we see a good divergence between price and RSI, and there is almost a double bottom pattern.
We had a strong bullish candlestick close to the support level, and the risk-reward is pretty interesting now. It must not lose today's low, though. The 13.7k is the target for now.
If you liked this trading idea, remember to click on the “Follow” button to get more trading ideas like this, and if you agree with me, click on the “Agree” button 😉.
See you soon,
Melissa.
