Bullish divergence on BTCHello
I have spotted a bullish divergence on BTC on RSII hope you like it, Overall I think there is a big chance that the current bull trend is over.
always use stop losses.
This is not financial advice.
Rsidivergence

BANKNIFTY - Bottom in place ?Multiple observations for Bank Nifty Daily Chart:
> Double Bottom Chart Pattern
> Bullish RSI Divergence
> Bullish Engulfing Candlestick Pattern
> 38.2% Fibonacci Retracement done from September Low of 20404.9
A break above today's high could take it to next falling trendline close to 34500.
(Not an investment advise)

AUD/USD Fractal play , Long opportunity !!Hello Trader,
good mood and profitable trades !
As you can see on the chart, I expect a bullish move similar to February
AUD/USD
Long
Fractal
RSI
Gan
Entry 0.77230
TP1 0.78148
TP2 0.79044
TP3 0.79591
TP4 0.79914
Remember that things can change too .
If you like this idea , support me with likes and comments !!
Dyor and trade save !


BTCUSD Daily RSI DivergenceI guess there is RSI divergence on daily chart. Price should fall below. Should watch carefully.
Do your own research.

Btc Bearish Case (RSI Bear Dev Fractal)Might skip pandemic crash this time :)
This analysis is totally based on this almost ridiculously the same RSI bearish divergence. It's a weekly fractal. Based on this idea, we might consider 7-8 months of bear market.
Comments welcome..

BTC next moves??BTC has fallen down due to some things in China... Everyone can find this out on the internet.
But on the technical side, BTC broke the trendline it held for several months!
After the drop, we have seen a nice pullback which means we are still in a bull market!
Right now it might be forming a nice H&S pattern.
We can also see a nice divergence on the RSI.
We need to broke the old triangle resistance line!
In the long term, I am still super bullish and I am expecting BTC to hit a 6digit number this year!
Remember drops are healthy and quite usual, use them as a nice opportunity to buy!

Reversal sign in ETH and other coinsHere we have bulish sign in RSI and also a cross up point in MACD. Also the 12345 wave is now completed and I think here is good place to open long.

EURUSD-Weekly Market Analysis-Apr21,Wk4The red box(sell zone) is drawn on the daily chart, I'm waiting for a bearish engulfing candle on the 1-hourly chart for a shorting opportunity.

Interesting times for LTC!Hi all,
I've been digging around in TA for a little bit, but of course with the whole crypto space being what it is nobody actually knows what will happen so happy trading and make your own informed decisions!
I try to trade by patterns and some TA indicators. This run has been awesome! I am looking to up my LTC holdings through some well timed buys and sells. Currently, I am seeing an opportunity for a sell with a potential buyback within the rising channel. Of course, sometimes we see what we want to see in these charts, so again-- not financial advice.
Bearish:
I found a bearish RSI and MACD divergence in this run.
The past few cycles when RSI has reached this point there has been a major downwards correction.
Further, LTC has been trading in these triangle patterns so I am wondering what the downwards leg of this triangle will look like when it comes.
Let's see how this pans out!
Bullish:
ALT SEASON!
FOMO
Huge run this morning.
Rising channel breakout
Good luck all

BTCUSD TA & BULLISH RSI DIVERGENCEWe are above the big H&S's neckline. I'm still bullish if we stay above 59500. We have an important BULLISH RSI divergence on 1h timeframe ! My first target is 68-69K if we don't break 59500.

Bitcoin has a little more to go downwards before finding supportBTCUSD has been in a rising channel since mid December 2020. It has, remarkably, maintained this rising channel and issues the channel's lower trend line as support around 4 times - this further providing evidence of channel integrity and lower trend line support.
Currently the price is approaching the lower trend line support and has a little more to go down before it reaches that level and potentially starts rising again. Based on trend analysis, the price level for support is between around $58000 and $57000.
A good entry point would be once the price hase moved into the zone, found support and moved back up with a minimum of 1 - 3 bars of confirmation of upward price trajectory (depending on risk preference) to avoid a false price bounce.
However, this would be a risky trade requiring active and closely monitored risk management due to the following cautionary notes.
The RSI and price are starting to show signs of longer term divergence. This divergence may be temporary and cancelled by the RSI beginning to trend upwards along with price off support from the lower trend line, however a divergence is a very strong technical signifier of trend reversal and demonstrates any future trade currently requiring a lot of risk management.
Additionally, the RSI recently reached an overbought peak and, coupled with its most recent peak being lower may be signalling a slowdown in the trend.
Furthermore, recent support from this lower trendline has not resulted in price movement reaching the upper trend level either signifying impending general downward pressure on price or general slow upward price movement.
Finally, in March 2021 the 50 DMA, lower trendline and price converged, which could have resulted in more powerful price action towards the upper trendline but didn't, further demonstrating resistance to major price movement upwards (although the total maximum price movement upwards was about a good 17% nonetheless, signifying profitable scalping potential based on this trend).

USDJPY-Weekly Market Analysis-Apr21,Wk3If you have been reading my analysis, you might be thinking USDJPY will be alike to EURUSD or GBPUSD. Well, not this time. USDJPY is in a unique situation where the daily chart is on a bullish trend, 4-hourly chart a weaker bull(which I will not take action) and 1-hourly a bearish trend. Knowing how to identify the trend helps a trader to determine if they are trading with the trend or against the trend. This information help traders to plan their stop and target better.
I'm waiting to short USDJPY at 109.87 as long as the trade didn't break and close above 109.95.

FILUSDT BullishHello traders. After a nearly 50% retracement, we now see the price back above the 9MA and the RSI above 60 with daily divergence. Targets are the Fibonacci projections on the chart. Good luck!

SQQQ may give us another +20% Pump: Bullish Shark HarmonicThe 4HR RSI seems to be coming out of the oversold territory within the PCZ of a Bullish Shark Harmonic, I think it could attempt to target previous Higher Resistance levels from here Potentially between $14-$16 if all goes well.

EURJPY - Crab PatternA bearish crab pattern form on the daily chart of EURJPY with an RSI Divergence. This trade can take up to 2 weeks for it to complete its run. Patience is required. Are you game for this?

NZDUSD - TrendlineTrendline - 1 of my favourite tools I use for trading, it is suitable for most trading situation and when using right, it can be a leading indicator. As long as the candle didn't close above 0.7043, the bearish trend stands.
Breaking and closing below 0.6997 shows that the strength is having a strong bearish run.

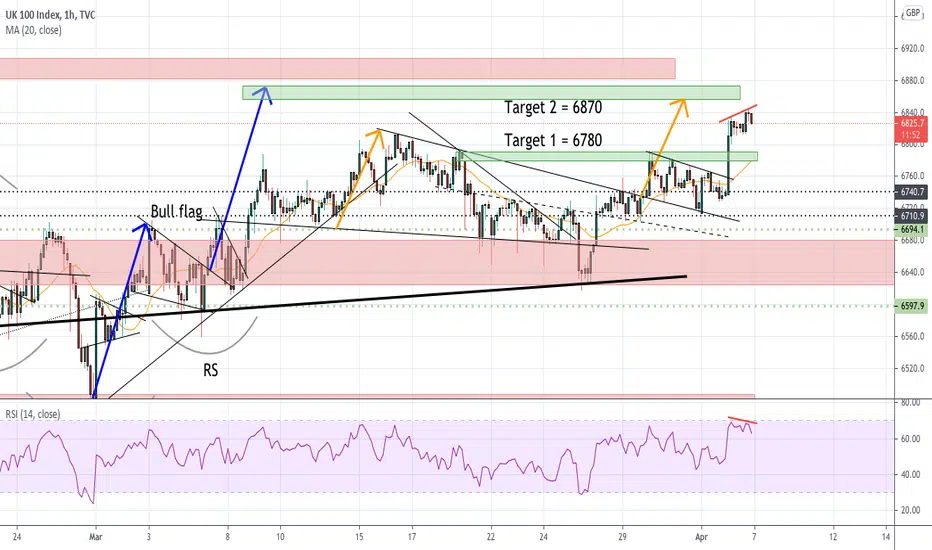
$UKX Hourly - Possible consolidation before final push higherMinor bearish RSI divergence has appeared on the hourly. Trend is still clearly up and full target of 6870 BUT momentum appears to be slowing. Taking some profit here on my longs and will look to add on a test of the green zone at 6780/6790.
USDJPY - Structure TradeA potential trend reversal trade might be in place. Having a break and close below the buy zone(turned to consolidation zone) is the 1st clue for a shorting opportunity. Market retraces and touches the red line without closing above the red line is the 2nd clue, the red line act as a Key Resistance Level, DM me if you don't understand. If the 8am(+3UTC) close as a bearish engulfing candle, it will give the 3rd clue for a shorting opportunity.

AUDUSD - Inverted Head&ShoulderThis is not the usual head&shoulders formation that I trade, it is because it didn't meet 1 of my critical criteria. But in this case, if the market retrace to 0.7599 and didn't close below 0.7591 on the 1-hourly chart, I may still consider to engage the trade

VLDR Keep your eyes on this one! Just wanted to show another analysis but on the hourly chart. Good chance this one could see a breakout soon.


NEOUSDT - Showing multiple divergence, time to take a trade :)Hi Traders!
On 1h chart of NEOUSDT, I found both MACD and RSI formed divergence, and an uptrend is about to reverse.
So it's time to take a short position to book some profit.
Entry SHORT - 45 USDT
TP - 42.75
SL - 46.62
Risk/Reward Ratio - 1.77 :)
