USDCAD - Head and ShouldersA mild RSI Divergence on Head and Shoulders setup. RSI Divergence is critical and it's a make or break criteria for me to head in for a trading decision on the potential head and shoulder setup.
Rsidivergence

Bitcoin Falling Wedge & RD+Bitcoin has been seeing some strong declines over the past week. During this time, a classic falling wedge has been formed. Falling wedges are bullish patterns.
This is therefore a bullish potential trade on BTC .
There is also a divergence in RSI (RD+), which is another sign of an uptrend
On the chart I’ve marked two potential areas of resistance, r1 & r2.
Do your own due diligence.

TDI Indicator for Entry SignalTDI (Traders Dynamics Index) is a powerful tool that determine the entry signal This indicator consists of 3 important indicators a below
RSI (30, 70) Period (20) --> Green
MA (50) --> Red
Bollinger Bands --> Yellow with Blue band lines
How to use the above indicator is as below
When the Green cross the Red positively, this is a green signal to buy
When the Yellow cross the Red positively, this is a green signal to buy
When the Yellow moves above the Red line, the market in up trend. If the Yellow moves below the Red line, the market in down trend
Crossing the Yellow line of the lower RSI band from bottom to top mean time to buy, while Crossing the Yellow line of the upper RSI band from top to down mean time to sell
Crossing the Yellow line the average RSI line (50) means time to buy
When the Green line cross the upper BB means the trend is strongly going up. If the Green line cross the lower BB line means the trend is strongly going down
Easily can determine the RSI Divergence (opposite top or bottoms) with the stock. If opposite bottoms, time to buy and if opposite top, time to sell
Best buy signal is when the Green line cross the Red line positively after the existing of RSI Divergence at the essential level

Bitcoin bottomingOn the 4 hours chart, there is a divergence between the price and the RSI.
The price is doing lower lows but the RSI is doing higher lows.
In every new low, the price penetrates less and less the lower bollinger band.
Bullish.

BITCOIN Correction should be over soon. Bullish Signals Visible
BTCUSDT is currently in its correction phase after its intense rally upwards.
Currently BTC is trading inside this Falling Wedge which is an extremely bullish continuation pattern, wedge is confirmed by the dropping decreasing volume. Also, the price is taking support at the 200EMA and the RSI is showing a Bullish Divergence on the 4 hours chart.
All these are some good bullish signals suggesting the uptrend is to continue hence Soon a breakout over the upper trendline.
However Since its weekend so like every weekend we might see drop in prices hence there might me a slim chance that the price would go down the wedge but there are lots of support levels between 38k and 42k.
The Support at 40k,laying on the 0.786 fib extension of the 'A' corrective wave is the strongest and its highly unlikely that the price would go below that. BUT anything could be possible so always use stoploss and this is just an idea so lets see what happens. I hope a bullish breakout happens.
All suggestions and corrections are welcomed :)

USDJPY - Head and ShouldersA potential Head & Shoulders setup with RSI Divergence gave an opportunity for the aggressive trader to engage their trade. The 1st target goes for 105.77 and target 2 will be shared with our inner circle.

Bearish Price Action Near Top of Ascending ChannelWe seem to be having significant bearish reactions every time we hit the top of the channel, It also looks like the RSI is struggling to make higher highs near overbought levels; Pair that with less than stellar earnings and you've got yourself a decent reason to enter a bearish position.

USDJPY - Support and ResistanceAs mentioned a few months back that USDJPY will hit a few bumpers along the way and 1 of it is at 106.01(chart at bottom)
I've engaged in an aggressive short and that is an attribute to candlestick formation, a doji on the resistance level way before the actual movement.
Once the price come in contact with the trendline, I will shift stops to entry and the candlestick close will be my main deciding point if I will intervene and exit the trade.

TOTAL2 Altcoin Market Cap RSI MACD Double DivergenceIt is really important to respect RSI MACD divergences since they most likely are working and showing you the way before it happens, also this situation happens at the exact 1.618 fibonacci extension level it is hard break through and the new trend's degree was quite high, so I am expecting a correction to the latest trend level drawn on the chart, the purple drawing shows the prediction of movement. I am keeping my positions open ( not futures ) , but I am aware that this is a possible scenario but eventually it will be the buying opportunity at it's best after the correction.

GBPUSD-Weekly Market Analysis-Feb21,Wk3GBPUSD on all 3-timeframe shows a retest of the previous high and market is unable to break and close above it.
On the 1-hourly chart, I'm waiting for a retest of the previous high for me to short the market base on a double-top setup with RSI Divergence.

EURUSD-Weekly Market Analysis-Feb21,Wk3I'm waiting for a shorting opportunity withing the red box which is the immediate sell zone. Do note that all 3 timeframes namely the Daily, 4-Hourly and 1-Hourly are showing a different setup, trade this pair with caution.

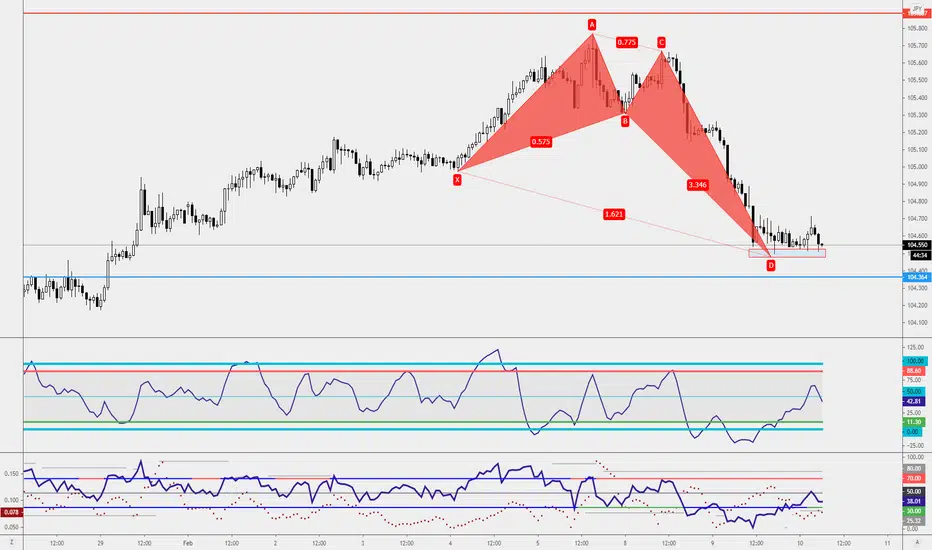
USDJPY - Bullish CrabThe crab pattern has not formed yet but a consolidation happens before it. If you don't mind to engage 2pips ahead of the completion, you can consider that. Stop-Loss I'm looking at 104.01.
End of correction and welcome impulsive wave!? SAFEPAL M15Technical analysis regarding the price of SAFEPAL in relation of dollar Tether for the next scenarios, based on 15 minutes movement.
Price found support along with 89 period EMA. Convergence with the RSI exceeding the neutral line * being positive and the price moving in an inverse way, with descending tops ~ divergence.
MACD losing selling pressure. Could it be the end of that correction !? Well, in the Technical context, we may be facing a new impulsive wave. Who knows!?
disclaimer
*** In accordance with CVM Instruction No. 598, of May 3, 2018, Art. 21, I declare that the recommendations of this analysis reflect solely and exclusively my personal opinions and perceptions and that they were prepared independently and autonomously. Not being considered a purchase and/or sale recommendation. ***

SAFEPAL 1H in flag formation! Defined objectiveTechnical analysis regarding the price of SAFEPAL in relation of dollar Tether for the next scenarios, based on 1 hour movement.
disclaimer
*** In accordance with CVM Instruction No. 598, of May 3, 2018, Art. 21, I declare that the recommendations of this analysis reflect solely and exclusively my personal opinions and perceptions and that they were prepared independently and autonomously. Not being considered a purchase and/or sale recommendation. ***

AUDCAD - Bearish BatThis can be a choppy ride for a shorting opportunity. Aggressive traders can look for an immediate shorting opportunity, which traders who are into Reward:Risk can look to place a pending order at 0.9840.
For this to be a bearish move, the market shouldn't break and close above 0.9855, which gives conservative traders an advantage.

Luna trend analysisLuna is showing divergence on both the stochastic and rsi, possible bearish reversal, or consolidating period.

LT - Pennant BreakoutLT given pennant breakout on hourly and 2 hr timeframe. Bearish divergence in rsi so it might retest bottom of pennant before upmove. Targets on chart...

Britannia - Bullish DivergenceBritannia has bullish divergence on 2 hr timeframe. taking a trendline support.Target on chart...

DAX RSI divergenceOn the Dax H4 chart we can see RSI divergence, all time high price, and the price touched the uptrend channel top, so we can wait a short term correction to around 13500.
I recommend to open short position on market price, take TP around 13500, and SL around 14300.
Trade at your own risk.
Please don't forget to like, follow, and comment, if you like my analysis.

HINDALCO - Short setup Stock is currently trading in third stage of market cycle .
1-Accumulation 2-Rally 3-Distribution 4-Rejection
currently at the peak , at the overbought zone. Has formed a broadening pattern on the top which is rejected by a overhead trendline.
RSI DIVERGENCE
Looking to short once the Chart pattern is broken and retested .

XLM breaking out?XLM 4hr bullish RSI divergence after a symmetrical triangle breakout, retest and resumption. Looking to cross 0.35 and should be good to go. My short term target is 0.5. Just my opinion not advice. Dirty chart.

NZDJPY - Bearish CrabAn RSI Divergence is born after the retest of the previous high give an opportunity for the risk-takers to engage the trade, there are 2 levels that traders need to observe, a break and close below of the red box and a break and close below of the black line for the safe passage towards the promised land(profit level).

Is the Market Due for a Correction?The SPY has been trading in an upward parallel channel since November - briefly dipping below during the selloff last week before sharply recovering.
I believe the market is due for a more extended correction for several reasons:
- The MACD and RSI are both displaying negative divergences, which is a bearish signal.
- Furthermore, the On-Balance Volume (OBV) is trending down. This indicates that smart money (aka institutional money) is flowing out of the market, possibly because they are anticipating a market-wide correction.
- The SPY could continue trading to the top of its channel, which coincides with the upper Bollinger band and the 0.618 Fibonacci trend extension. Each of these indicators can act as resistance as the price approaches from below.
I will likely take some profit and/or hedge agaisnt downside risk with UVXY calls before the end of the week.
Good luck trading.
