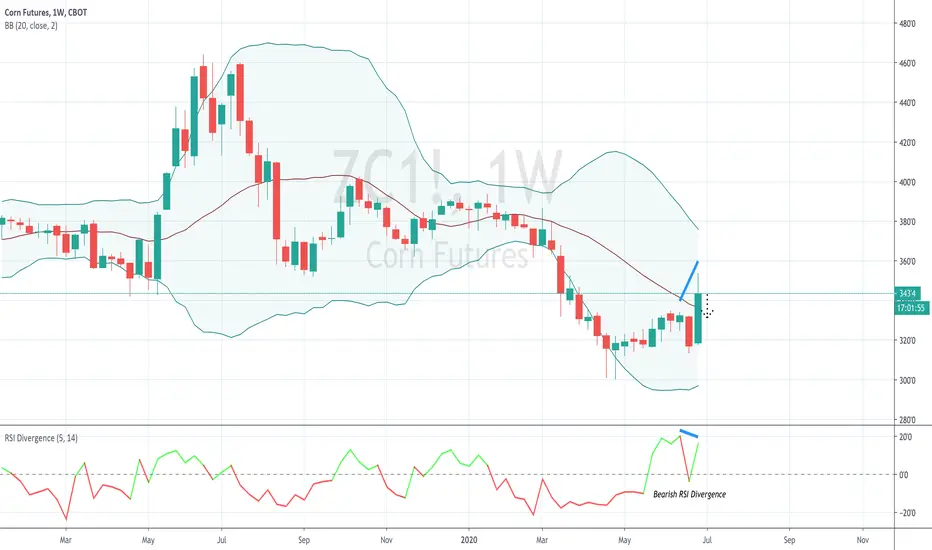
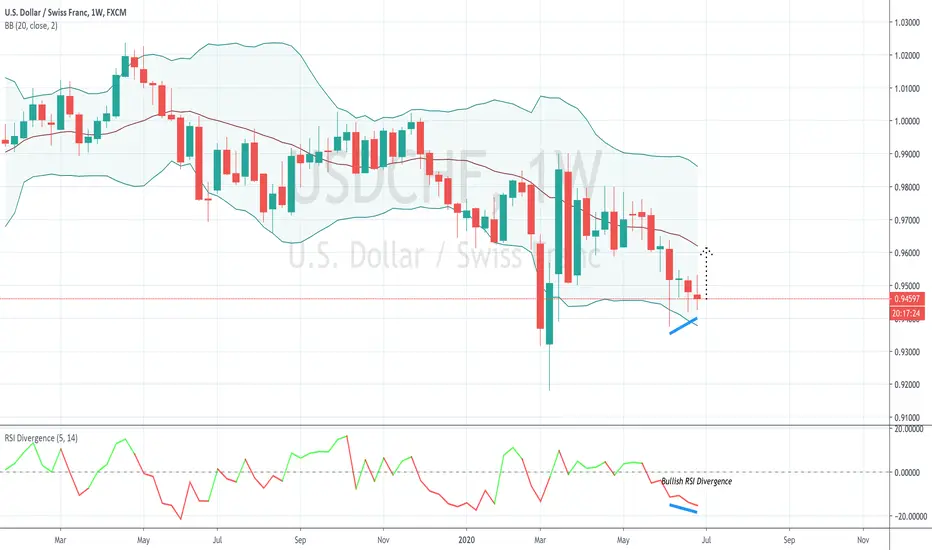
Rsidivergence

Zoom out and you will understand...73b for a video service????? come on get serious
1. Easy to copy paste it
2. How much money do you expect companies to spend on video service over long term?
Waiting for RSI divergences on multiple timeframes, there is a chance it will go up to 100b and then the real fun will start... with 2 hands & 2 feets i am going to short it there without a stop loss...


USDJPY LongRSI divergence just started with strong upwards momentum on the last 1h candle so would look to go long based on a continued ranging market enviroment.

$SNAP Possible Correction?$SNAP is showing signs of reversal. It shows RSI divergence, and it completed 5 Elliott wave, along with red dogi candle which indicates price reversal. Looking to $SNAP to pull back to supporting level and go on from there.

$PNTUSD / $EDOUSD Watchout binance tradersUpon rebranding EDO ti PNT and listing on binance, I expect big drop from this resistance. A lot of confluence in this area and indicators signaling for a pullback, and posible trend reversal.
Chart on binance is only this double top you see here on bitfinex, so traders there cannot see a full picture, and will be caught in a trap. Don't be a buyer here, no matter what the fundamentals are.
1. Trendline broken, possible fakeout, this whole area acts as a resistance, not a single line.
2. Rsi bearish div.
3. Double top formation
4. Tweezers top x2 (candlestick formations, usually signaling for a trend reversal because price cannot go higher or a lower than those wicks)
5. 78.6 fib retracement
6. M market structure broken, but only with the candle wick. Sign of support weakness.

#Apple - good byeRSI divergence with the shittiest candle close possible ( bearish shooting star)
Possible H&S in the making as well
now understand that Fundamentals will overpower the TA on this one this is my first try at stocks so trade carefully
#notfinancialadvisor!! #DoYourOwnResearch

#BankNifty - Rising wedge trading inside a rising wedge possible one final push left before 19% correction
Green is the target
printing possible bullish divergence on 4hr need to wait for more PA before confirming that is one of the reason i think we will have one more push before final leg down


GBPJPY - Head&ShouldersA head and shoulders setup on the GBPJPY with an RSI Divergence. Once the market opens, I'll wait for about 3-4hours for the market to settle down before I head in for a shorting opportunity. While it all looks good, a candle confirmation is still required.


USDCAD - Is Short Term Uptrend Came to EndTrading Confluences,
Price reject 4-Hour Resistance Level
Price Starts to Creat Lower Highs
Price Broke Minor Trend Line
RSI Divergence
Trade Idea - Consider going short if price broke below the local structure level and retest it successfully.
Trade Analysis from Trade Revenue Pro
