Rsidivergence

EURUSD - Double Bottom at Support LevelTrading Confluences,
4-Hour Support Level
Double Bottom
RSI Divergence
Trade Idea - Consider Going Short if Price Actions Retest the Local Structure Level.
Trade Analysis From Trade Revenue Pro

The Holy Grail of RSI - How to use RSI Effectively 4 BIG PROFITSHello Traders,
This video explains how I use RSI to generate big returns in the Forex market. RSI has always been one of my favorite leading indicators I use when looking for confirmations. I highly recommend it. Take a few minutes to watch my video and learn how to use it effectively for intraday trading.
Trade Safe - Trade Well
~Michael Harding


USDCAD: possible long opportunityUSDCAD is breaking the trendline formed since the beginning of this week.
On the chart you can see some support/resistance areas + RSI divergence + price above all moving averages and not too far away...
Stocks and oil are under pressure, thus risk-off is favorable for USD bulls.
Another USD long already opened.
Entering the position around 1.3560 (current level) with 1.3780 T/P and 1.35 S/L provides decent R:R=3.
Wait for confirmation and relevant price action on the lower time-frame before entering the position.
//
Make your own analysis before entering position.
Feel free to share your opinion/position via comment and follow me to stay updated + support my work by hitting like.)

EURUSD - Head and ShouldersThis is not the typical head and shoulders trade I'll engage but the filter it's pretty good, Will observe how this candle close and will decide this trade in a moments time.

EURUSD: possible short scenarioThe main fundamental risk is continuation of the risk-on in equities, otherwise we can expect another strengthening of the dollar, which proved to be a risk-off instrument.
From techincal POV:
-H&S chart pattern
-RSI divergence
Joining EURUSD bears from around 1.1262 price with S/L above 1.1360 and T/P around 1.1000 level provides decent R:R.
//
Make your own analysis before entering position.
Feel free to share your opinion/position via comment and follow me to stay updated + support my work by hitting like.)

#adobe - #marketcrash 2.0Just like #apple -
Bearish Divergence printed, expecting a retrace to Red long term trendline & Fibonacci levels on chart

#apple - Bearish Divergence - #marketcrash 2.0Rsi has printed huge bearish divergence on weekly timeframe, expecting one more leg down soon

XAUUSD Short OpportunityHidden Bearish RSI Divergence is present. Indicating a possible bearsish continuation.
Currently trading in a descending channel.

Short Trade IdeaDaily bearish divergence, with head & shoulders pattern and confluence with price closes below 50 EMA. Sell on breakdown at resistance turn support (purple area).

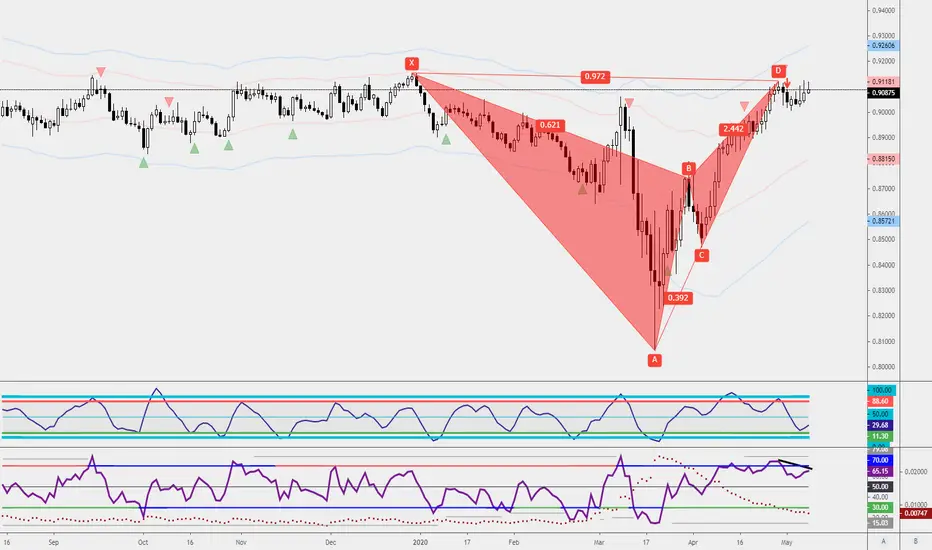
GBPUSD-Weekly Market Analysis-Jun20,Wk1Within the sell zone, a potential bearish bat pattern is going to form, even so, a candle confirmation is important in this trend trading opportunity.
This trade might just yield a great profit.

#Bitcoin - Longing againI see good confluence here on the chart with Fibonacci & ascending triangle support trendline, daily also possible bullish diversion printing, we might not get to 11k but even 1000$ move to 9700 is good for leverage trades.
Laddering longs till 0.75 (using only 5% of balance)

Short Trade IdeaSpotted RSI divergence at 4HR TF, price need to break the trendline (bearish momentum candle) and/or bearish price action like H&S pattern, etc. for confirmation.

Trade Ideas Analysis: EURJPY DivRsi Divergence on the 1-hourly timeframe where market retest the previous high. If the current candle closes the way it is at the 4pm(+8GMT) candle, I engage this on an aggressive short.

Trade Ideas Position: AUDCAD SharkA bearish shark setup on a counter-trend trading opportunity. Trade has engaged, waiting for a shorting opportunity when the market check-back.

Trade Ideas Position: NZDJPY SharkThis is what typically happens to a shark pattern, you get bitten the previous round and you come in for more.
A shark pattern can have as much as 3 entry price, if you aren't familiar with it, you can get a bitten twice in a row and you may say, no, I'm not engaging this trade.
Guess what can happen on the third run? It can hit your target profit and you get all upset on it.

Trade Ideas Position: NZDJPY SharkA confirmed bearish shark pattern setup with arrow confirmation. On both the 1-hourly and 4-hourly chart it is a ranging market, but on the daily, it is a trend trading opportunity.

ENJ LOOSING MOMENTUMENJI LOOSING MOMENTUM, DOUBLE TOP WITH BEARISH DIVERGENCE ON THE RSI, INVERTED HAMMER CANDLESTICK
TP: THE TWO GREEN BOXES

Trade Ideas Position: AUDCAD BatA bearish bat setup check-backed for a shorting opportunity. The RSI divergence and the long shadow candle do sweeten the deal.
Trade Ideas Educator: NZDUSD Bearish SharkA slight push higher will activate a bearish shark pattern, having that move may sound good but it also breaks the resistance level on the higher-timeframe, the 4-hourly chart(check out the link at the bottom).

Crude Oil | July contract continues to look bullish
the trend change of crude oil started at 29 Apil, signaled by RSI divergence or RSI failure swing
the second green arrow indicates the second long position, which was the buildup of a to-be breaking double bottom
an ascending trendline was then formed, which is never broken
the price then broke out, half of the profits was taken at the red arrow, by expecting a pullback
the third green arrows indicates the re-entry at the consolidation area
as the last trading day of June contract is approaching, July contract will be a better trade

GBPUSD-Weekly Market Analysis-May20,Wk2A head and shoulders setup for a buying opportunity. As this is not the usual head and shoulders setup that most will expect but the chart is not perfect. There is an RSI Divergence on this setup and if all fail the consolidation area do provide a buying opportunity on this setup.
