Head and shoulders Head and shoulders reversal pattern
Price broke the neck line
RSI shows divergence
Wait for pullback then sell
Target: 61.8 fibo level
Good Trade!!!
Rsidivergence


Trade Ideas Position: EURJPY BatA bullish bat setup and completes as X surely pose a warning sign, if you head up to the 4-hourly and daily chart, at this moment the level is not within any support level.
Advantage of this trade is that it yields a very good RRR and an RSI Divergence.
What's your take on this?

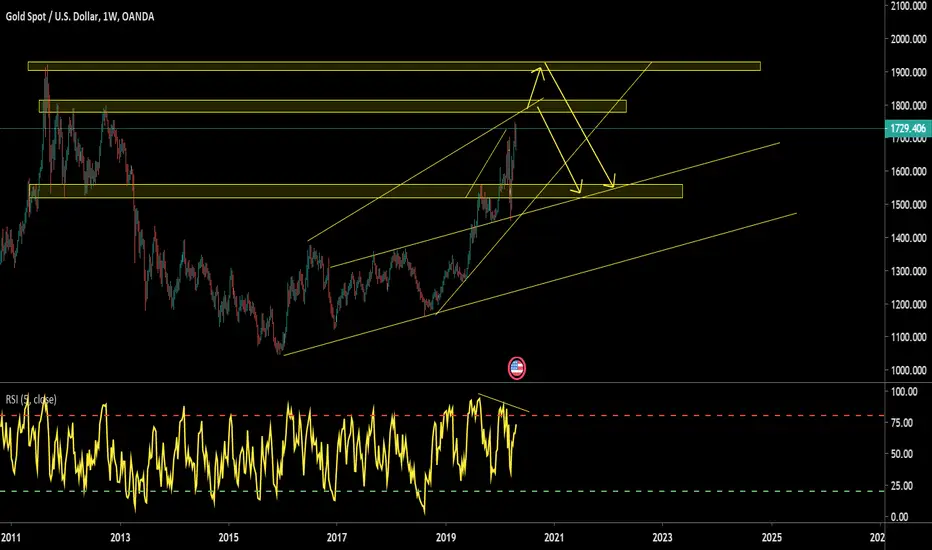
GOLD RSI showing DivergenceThe price of Gold is in an uptrend , what to expect next as the wave will be to the downside. However, the price is expected to fall max to 1600$
EURJPY Long oportunity - Bounce upFX:EURJPY
EURJPY reaching the end of the pattern.
It is now trading next to an important support range showing signs of weakness it will possibly bound on this zone and go long with 4 different level targets to get your profit
- MACD and RSI diverge on the weekly chart
Next week we should see this shorting towards the 116.292 support line and the beginning on the bounce aiming for our first take profit level 118.410
Keep the eyes open for the bounce and enjoy the ride :)

EUR/CHF The Bulls are Ignoring All Technicals.Let's go over the different things that are happening here on EURCHF. The price made a Bearish RSI Divergence in this uptrend on EURCHF. The price indeed retraced slightly after this happened, but the overall uptrend was too strong.
The uptrend continued and made its way to the horizontal resistance area. After the area was hit, the price struggled a little bit but broke through eventually.
Since the bulls managed to win from the bears on all of these occasions despite the technicals against them, I decided to go for a long trade here.
Follow me for consistent high quality updates, with clear explanations and charts.
Please like this post to support me.
- Trading Guru
--------------------------------------------------------------
Disclaimer!
This post does not provide financial advice. It is for educational purposes only!

Double Bottom gonna happenIt seems a good double bottom pattern going to form on SOLBTC chart.
Bottoms are exactly on the 0.618 fibo retracement level and we have an obvious RSI divergence on the chart.
neckline is around 10200 and the target is 11200 around 0.5 fib. level.
please hit the like if you found this idea useful.
join us on Crypto Academi

Trade Ideas Analysis: GBPJPY WedgeA rising wedge setup as a Trend Trading Opportunity, it is an advance move than I would normally take and that is because it is well resistance at the 4-hourly chart and it is considered as a trend trading setup based on the 4-hourly chart.

Trade Ideas Educator: GBPJPY WedgeA rising wedge has formed with an RSI Divergence got me shorted this pair, on the coming week I'm waiting for the candle to break and close below the lower trendline of the rising wedge, followed by a retracement for me to engage a trade to short it with an added position.

How near is the END? S&P 500Look on the behavior of DMI on the previous crashes, it keeps falling while the index is falling as well and RSI builds up a bullish divergence. It does not necessarily mean that history repeats itself, just pointing this out.

EURJPY Head and ShouldersA head and shoulders setup on EURJPY, not something I will engage the trade, unless a major retracement. It's nice to see the RSI Divergence but once when I do not have a great Reward: Risk, I don't engage.

Trade Ideas Position: GBPAUD ABCDA bearish ABCD pattern setup for a shorting opportunity, on top of the sideways bounce setup that I've mentioned yesterday(linked at the bottom).

Trade Ideas Analysis: GBPAUD SidewaysSideways bounce detected with a checkback on the arrow. This setup is considered as a counter-trend.

USDJPY-Weekly Market Analysis-Mar20,Wk4Head up to the daily chart, and you will see that the market has just retested the previous high.
There are two disturbing trendlines which act as strong support on this pair, especially if you are looking for a shorting opportunity. A break and close below the trendline and engage after the retracement would be a help.

Trade Ideas Educator: AUDUSD GartleyA bearish gartley setup within the sell zone and an ABCD pattern complete within the gartley pattern. In addition to this, an RSI Divergence setup within the completion of this pattern.
I will be setting a sell limit on this trade once the market opens, Entry, Stop and Targets will be sent.
Check out the link(3) to be a part of our community.

EURUSD-Weekly Market Analysis-Apr20,Wk1The bearish butterfly pattern setup signals a potential retracement on EURUSD. The candle did go past the HOP level, but right now the Arrow indicator has shown up with an RSI Divergence(red line).
Traders can wait for a break and close below the HOP level(without touching target 1) and retrace back to 1.1132 for a potential shorting opportunity.

Trade Ideas Position: GBPAUD SharkA trend trading setup on GBPAUD is spotted on the 1-hourly timeframe. The market has an arrow indicator and to further confirm the setup there is an RSI Divergence on this trade.
Let see if we are still in time for this setup. Check out link(3) to receive my entry, stop and targets.

EURUSD-Weekly Market Analysis-Mar20,Wk4With coronavirus pandemic, it has caused great damage to Europe, thus causing one of the greatest depreciation that we have lived to witness.
Right now, the market double bottomed with RSI Divergence on EURUSD at the HOP level. It might be a great opportunity for bold countertrend trade to head in for a shot.

Trade Ideas Position: EURUSD BatThe bearish bat pattern has set up for a trend trading opportunity. I will wait for a candle confirmation before engaging the trade.
An RSI Divergence formed within the setup. Levels sent to our community, check out the link(3) on my trading view account.

RSI Bullish Divergence on QTUM BTC [QUICK UPDATES]Hey all, the Trading Guru is back with another entry on a new series called 'Quick Updates'.
We can see the RSI here making a higher low, while the price is making a lower low. This is an indication of reduced momentum, showing that bears are struggling to push the price down. This unsustainable push will lead to an increase in price by creating more momentum for the bulls.
At the same time, the price is hitting a place of horizontal support. This confluence of two signals at the same time make this signal very strong. I am feeling very bullish on this one, as we got an even stronger signal on an already positive streak.
This can lead to a great scalping opportunity. Don't expect huge gains here, but use it as a way to identify a short term reversal. You have to take into account that we're on the 15m timeframe.
--- What is The Quick Update Series All About? ---
I am starting a new tag (quickupdates) where I quickly share great opportunities based on TA for shorter timeframes, such as 4h, 1h, and 15m. It will not contain just a short explanation, in order to keep the velocity up and make sure you get to see the opportunities as fast as possible.
Follow me for consistent high quality updates, with clear explanations and charts.
Please like this post to support me.
- Trading Guru
--------------------------------------------------------------
Disclaimer!
This post does not provide financial advice. It is for educational purposes only!
About the links below:
20% Discount on Binance: Did you know that Binance introduced a new system where you can get 20% discount on your fees? Find the step-by-step guide on how to add it to your account on the website of 100eyes
Forex & Crypto Scanner: Nobody can keep track of all the pairs on all timeframes. This scanner works on Telegram and sends an automated message including a chart every time something happens to a coin. E.g. it can automatically detect areas of support and resistance, RSI Divergences, Fib Retracements, and more.

Head and shouldersPreviously I published this idea with a false broke of neck line.
This time, it clearly broke with strong volume.
I'll wait for retest of neck line, then i'll sell it.
RSI divergence and is descending.
Good trade!!!

SPX analysis [17May20 UPDATE]See also my previous analysis, examining historical behavior and confluences with indicators.
+ Fractal based speculation of how far down the index might go.

EURUSD-Weekly Market Analysis-Mar20,Wk3A retest of support on the trendline and a reversal candle that break and close above the previous high(yellow eclipse), signal a potential reversal setup. Trend Engage based on counter-trend trade, that means I would not stretch for an extended target.
