PORTALUSDT.P 4H SHORTPrice is currently heading towards resistance trendline and horizontal resistance zone @ 0.04372. Expecting bearish reaction on resistance trend line third touch. A strong bearish engulfing pattern will signal this reversal to at least 0.03604.
Rsistrategy

Skeptic | RSI Masterclass: Unlock Pro-Level Trading Secrets!Hey traders, it’s Skeptic ! 😎 Ready to transform your trading? 95% of you are using the Relative Strength Index wrong , and I’m here to fix that with a game-changing strategy I’ve backtested across 200+ trades. This isn’t a generic RSI tutorial—it’s packed with real-world setups, myth-busting insights, and precise rules to trade with confidence. Join me to master the art of RSI and trade with clarity, discipline, and reason. Big shoutout to TradingView for this epic free tool! 🙌 Let’s dive in! 🚖
What Is RSI? The Core Breakdown
The Relative Strength Index (RSI) , crafted by Welles Wilder, is a momentum oscillator that measures a market’s strength by comparing average gains to average losses over a set period. Here’s the formula:
G = average gains over n periods, L = average losses.
Relative Strength (RS) = | G / L |.
RSI = 100 - (100 / (1 + RS)).
Wilder used a 14-period lookback , and I stick with it—it’s smooth, filters noise, and gives a crystal-clear read on buyer or seller momentum. Let’s get to the good stuff—how I use RSI to stack profits! 📊
My RSI Strategy: Flipping the Script
Forget what you’ve read in books like The Handbook of Technical Analysis by Mark Andrew Lim— overbought (70) and oversold (30) aren’t just for shorting or buying. I go long when RSI hits overbought, and it’s been a goldmine. I’ve backtested over 200 trades with this approach, and it’s my go-to confirmation for daily setups. Why does it work? When RSI hits overbought on my 15-minute entry chart, it signals explosive buyer momentum. Here’s what you get:
Lightning-Fast R/R: I hit risk/reward targets in 30 minutes to 2 hours on 15-minute entries (longer for 1-hour entries, depending on your timeframe).
Massive R/R Potential: An overbought RSI on 15-minute can push 1-hour and 4-hour RSI into overbought, driving bigger moves. I hold for R/Rs of 5 or even 10, not bailing early. 🚀
Rock-Solid Confirmation: RSI confirms my entry trigger. Take BTC/USD:
BTC bounces off a key support at 76,000, sparking an uptrend.
It forms a 4-hour box range, but price tests the ceiling more than the floor, hinting at a breakout.
Trigger: Break above the box ceiling at 85,853.57.
On 15-minute, a powerful candle breaks the ceiling, and RSI hits overbought—that’s my green light. I open a long.
Soon, 1-hour and 4-hour RSI go overbought, signaling stronger momentum. I hold, and BTC pumps hard, hitting high R/R in a short window.
This keeps trades fast and efficient—quick wins or quick stops mean better capital management and less stress. Slow trades? They’re a mental grind, pushing you to close early for tiny R/Rs. 😴
Pro Rules for RSI Success
Here’s how to wield RSI like a trading weapon:
Stick to the Trend : Use RSI in the direction of the main trend (e.g., uptrend = focus on longs).
Confirmation Only: Never use RSI solo for buy/sell signals. Pair it with breakouts or support/resistance triggers.
Fresh Momentum: RSI is strongest when it just hits overbought/oversold. If the move’s already rolling, skip it—no FOMO, walk away!
Customize Zones: Overbought (70) and oversold (30) can shift—it might show reactions at 65 or 75. Adjust to your market’s behavior.
Backtesting RSI: Your Path to Mastery
To make RSI yours, backtest it across at least 30 trades in every market cycle— uptrend, downtrend, and range. Test in volatile markets for extra edge. 😏 Key takeaways:
Range Markets Kill RSI: Momentum oscillators like RSI (or SMA) are useless in ranges—no momentum, no signal. Switch to ROC (Rate of Change) for ranges—I use it, and it’s a beast. Want an ROC guide? Hit the comments!
Overextended RSI Zones: On your entry timeframe (e.g., 15-minute), check higher timeframes (e.g., 4-hour) for past RSI highs/lows. These are overextended zones—price often rejects or triggers a range. Use them to take profits.
Final Vibe Check
This RSI masterclass is your key to trading like a pro—fast R/Rs, big wins, and unshakable confidence . At Skeptic Lab, we live by No FOMO, no hype, just reason. Guard your capital— max 1% risk per trade, no excuses. Want an ROC masterclass or more tools? Drop a comment! If this fired you up, smash that boost—it means everything! 😊 Got a setup or question? Hit me in the comments. Stay sharp, fam! ✌️

Beautiful ABCD pattern appearing on bigger tf.Beautiful ABCD pattern appearing on
bigger tf.
Crossing 101 - 102 with Good Volumes may
trigger new highs towards 120 atleast.
78 - 80 is an Immediate Resistance area.
On the flip side, a Very Strong Support is
around 68 - 70 & then around 62 - 63

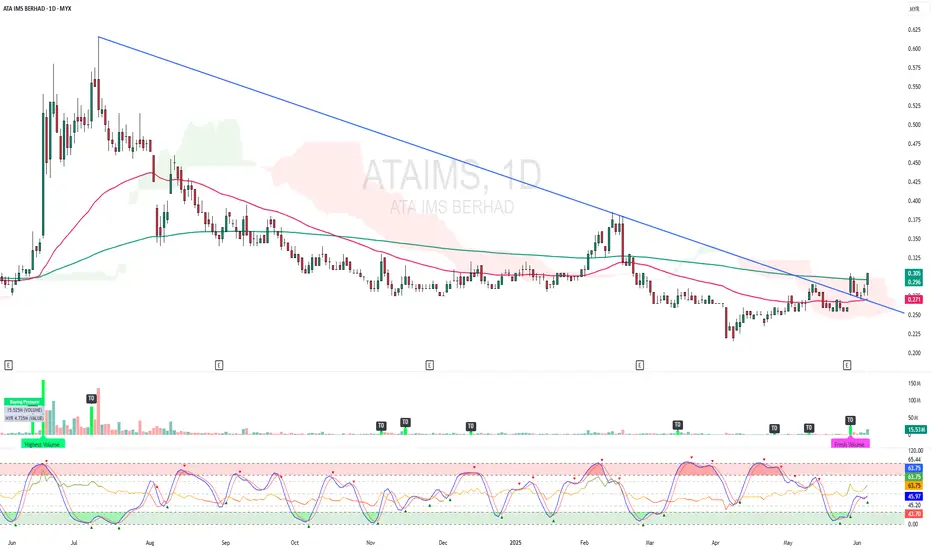
ATAIMS - BREAKOUT EMA 200 and CLOUD !ATAIMS - CURRENT PRICE : RM0.305
ATAIMS is bullish as the price is above EMA 50 and 200. The stock broke above EMA 200 and ICHIMOKU CLOUD on last FRIDAY (06 JUNE 2025) with high volume. Supported by technical reading in RSI heading upward, the stock may continue to move higher in the upcoming session.
ENTRY PRICE : RM0.300 - RM0.305
TARGET PRICE : RM0.340 and RM0.370
SUPPORT : RM0.270
A Different Way To Use the RSI To Trade Deceleration Patterns A deceleration pattern is a pattern that forms at the end of a directional move as it starts to lose steam. 2 good ones to learn are the rising/falling wedge & channel.
The problem wit these patterns however, is that it can sometimes be difficult to tell when that final reversal may come backing it hard to place stops.
Lately, and by that I mean for the past year or so, I've been tracking a very specific pattern on the RSI (Relative Strength Index) indicator to help me with these situations.
Please LIKE & SHARE and if you have any questions or comments, leave them below
Akil

Bullish on bigger tf but Strong Resistance ahead.
Bullish on bigger tf.
Strong Resistance around 128 - 129
If this Resistance is Crossed & Sustained
on monthly basis, we may witness upside
towards 200+

Fartcoin: Is the Smell of a Downtrend in the Air? 📉 Fartcoin: Is the Smell of a Downtrend in the Air? 💨
🚨 Alert: The RSI is holding its nose... and so should we.
After a suspiciously bubbly rally, $FARTCOIN is now showing bearish RSI divergence on the 4H chart — and let’s be honest, it’s starting to stink. 🦨
The recent price action looks like someone tried to pump it... but forgot to ventilate. 💣💨
🧻 Support is about to get wiped.
💩 MACD says momentum is going down the drain.
🚽 Volume drying up like gas after Taco Tuesday.
TA Summary:
RSI Divergence ✅
Rising wedge (aka clogged pipes) ✅
Community still in denial? ✅

RSI 101: Revealing the Special Characteristics of RSIWhy does RSI have support and resistance levels at 40 and 60?
Why does divergence happen between RSI and price?
What is RSI momentum?
All the characteristics of RSI (that I know) will be explained here.
Formula and Meaning
If you are using TradingView, you probably already know what RSI is and what "overbought" and "oversold" mean. So, I won’t repeat it here. Instead, I’ll dive deeper into the true nature of RSI, giving you a different perspective.
You can skip the mathematical formula of RSI, it’s already discussed everywhere online. Just remember this ratio table:
Here’s how I explain the table:
At RSI = 50, the average gain equals the average loss (I'll call this the buy/sell ratio). This is a balanced point. Buyers and sellers are equally strong.
At RSI ~ 60 (66.66), the buy/sell ratio = 2/1. Buyers are twice as strong as sellers.
At RSI ~ 40 (33.33), the buy/sell ratio = 1/2. Sellers are twice as strong as buyers.
At RSI = 80, the buy/sell ratio = 4/1. Buyers are four times stronger.
At RSI = 20, the buy/sell ratio = 1/4. Sellers are four times stronger.
The formula shows that when RSI reaches 80 or 20, the buyer or seller is extremely strong — about four times stronger — confirming a clear trend.
At these levels, some Trading strategies suggest placing a Sell or Buy based on the overbought/oversold idea.
But for me, that’s not the best way. The right approach is: when a trend is clearly formed, we should follow it.
I'll explain why right below.
Look at this chart showing RSI changes with the buy/sell ratio:
When RSI > 50:
When RSI < 50:
You can see that the higher RSI goes, the slower it climbs, but the high buy/sell ratio makes price move up faster.
Similarly, when RSI goes lower, it drops slower but price drops faster.
That’s why at overbought (RSI=80) or oversold (RSI=20) areas, you need to be careful. Even a small RSI moving can lead to big price changes, easily hitting your stop loss.
On the other hand, if you follow the trend and wait for RSI to pull back, you will trade safer and more profitably.
RSI Key Levels
Here are some special RSI levels I personally find useful when observing FX:XAUUSD :
(These levels are relative. They might vary with different timeframes or trading pairs. Check historical data to find the right ones for you. On bigger timeframes like M15 or above, the accuracy is better.)
RSI = 20
When RSI hits 20, sellers dominate. This confirms a trend reversal to bearish.
RSI = 80
When RSI hits 80, buyers dominate. This confirms a trend reversal to bullish.
RSI = 40
This is a sensitive level. Sellers start gaining the upper hand (sell/buy = 2/1).
If buyers lose 40, they lose their advantage.
So RSI >= 40 is "buyer territory". In an uptrend, RSI usually stays above 40.
RSI = 40 acts as support in an uptrend.
RSI = 60
Same idea. RSI <= 60 is "seller territory".
RSI = 60 acts as resistance in a downtrend.
40 and 60 are considered the key levels of RSI.
Now you guys know why RSI has support/resistance around 40/60!
RSI Range
As you know, RSI moves between 0 and 100.
Since RSI >= 40 is buyer territory, we can see the relationship between price and RSI:
When RSI stays above 40, price tends to move in an uptrend:
When RSI stays below 60, price tends to move in a downtrend:
When RSI stays between 40 and 60, buyers and sellers are balanced, and price moves sideways in a box:
When RSI is moving, It creates a RSI Range.
Whenever the trend switches between the three states — uptrend, sideways, and downtrend — a Range Shift is formed.
At first, RSI moves in 40-60 range, price moves sideways. A strong price move pushes RSI to 80. Later, RSI stays above 50, helping price grow strongly. When momentum fades, RSI returns to 40-60 and price moves sideways again.
Note:
RSI reflects Dow Theory by showing the stages of accumulation, growth, and distribution.
And as you see, when RSI touches key levels, the trend often pulls it back.
RSI Momentum
Price momentum means how fast price changes.RSI momentum represents the change in the strength between buying and selling forces.
When RSI > 50:
If price falls, RSI shows high momentum — RSI drops fast but price drops slowly.
If price rises, RSI shows low momentum — RSI rises slowly but price rises fast.
For example, at first RSI is above 50.
Price drops from (a) to (b) by 44 units, RSI drops from (Ra) to (Rb) by 25 units.
Later, RSI drops from (Rb) to (Rc) (also 25 units) but price drops from (b) to (c) by 73 units.
When RSI < 50:
If price falls, RSI has low momentum — RSI drops slowly but price falls fast.
If price rises, RSI has high momentum — RSI rises fast but price rises slowly.
RSI and Price Divergence
Divergence happens when price and RSI move in opposite directions:
Price goes up but RSI goes down, or vice versa.
Why does divergence happen?
In a strong downtrend, price forms a bottom at point (1), and RSI drops to level (r1).
When a price pullback happens, price pushes up to a peak at point (2), and RSI also bounces back to level (r2).
Because the downtrend is strong, after completing the pullback (1-2), price continues to make a lower bottom at point (3).
At this point, remember the behavior of RSI momentum when RSI is below 50:
It takes a large price drop (from 2 to 3) to cause a small RSI drop (from r2 to r3).
Meanwhile, even a small price increase (from 1 to 2) causes a large RSI rise (from r1 to r2).
Since the distance (1-2) is smaller than (2-3), but the RSI move (r1-r2) is bigger than (r2-r3), divergence is created.
Divergence shows that the current trend is very strong, not a complete signal of a trend reversal.
(I might share with you how to spot a complete RSI reversal signal in future posts.)
As shown in the example above, after forming bottom (5) and creating a bullish divergence between (3-5) and (r3-r5), price still kept dropping sharply while RSI kept rising.
In these areas, if you keep trying to catch a reversal just based on divergence, you will likely need to DCA or cut your losses many times.
That’s why the most important thing in trading is always to follow the trend.
RSI Exhaustion
RSI Exhaustion happens when RSI keeps getting rejected by a resistance or support zone and can’t break through.
After a strong downtrend, RSI recovers but stalls around the 5x zone.
It tries many times but fails, showing buying power is weakening.
Then the downtrend continues:
Exhaustion near high or low RSI levels creates stronger divergences than exhaustion in the middle range:
Double or triple tops/bottoms on RSI (M or W shapes) basically indicate RSI exhaustion.
RSI Can Identify Trend Strength
In an uptrend:
If RSI pulls back to a higher level before going up again, the trend is stronger.
The pullback should not fall too deep (below 40).
Example:
First rally: RSI drops to 60 before rising again → strong rally (273 units).
Second rally: RSI drops to 50 before rising again → weaker rally (94 units).
Same idea for a downtrend:
If RSI pullbacks to 50 then drops again, the downtrend is stronger than if it pullbacks to 60.
RSI Support and Resistance
Besides 40-60 acting as support/resistance, RSI also reacts to old tops and bottoms it created.
Why does this happen?
RSI is calculated from closing prices.
On a higher timeframe, the candle close price is a high/low or support/resistance price on lower timeframes.
When RSI moves in a trend on a higher timeframe, it maintains a buy/sell ratio, forcing lower timeframe RSI to oscillate within a range.
Example:
On H4, RSI stays above 40 → uptrend.
It makes H1 RSI move between 30-80.
Sharp RSI tops/bottoms react even stronger because they show strong buying/selling forces.
Summary
When looking at the price chart, we can see that price can rise or fall freely without any defined boundaries.
However, RSI operates differently: it always moves within a fixed range from 0 to 100.
During its movement, RSI forms specific patterns that reflect the behavior of price.
Because RSI has a clear boundary, identifying its characteristics and rules becomes easier compared to analyzing pure price action.
By studying RSI patterns, we can make better assumptions and predict future price trends with higher accuracy.
I have shared with you the core characteristics of RSI, summarized as follows:
Besides overbought (80) and oversold (20), RSI respects 40 and 60.
40 is support level in an uptrend. 60 is resistance level in a downtrend.
In an uptrend, RSI stays above 40.
In a downtrend, RSI stays below 60.
An RSI Range-Shift leads to a trend change.
RSI Divergence shows strong trends.
Double or triple tops/bottoms show RSI exhaustion → potential reversals.
The higher the RSI level, the slower it moves, but the faster the price rises.
The lower the RSI level, the slower it moves, but the faster the price falls.
A strong uptrend can be identified when RSI moves within a higher range or shows continuous bearish divergences.
A strong downtrend can be identified when RSI moves within a lower range or shows continuous bullish divergences.
RSI reacts to its old tops and bottoms.
Sharper RSI peaks show stronger selling.
Sharper RSI bottoms show stronger buying.
In the next parts, I’ll show you how to apply these RSI's Characteristics to trend analysis, multi-timeframe analysis, and trading strategies, that you might have never seen before.
I trade purely with RSI. Follow me for deep dives into RSI-based technical analysis and discussions!

GOLD - Day Trading with RSI 04/02/2025
Weekly and Daily Timeframes (W & D):
GOLD is still in an uptrend, as the RSI's WMA45 is still hovering near the 70 level, and RSI remains above both of its moving averages.
H4 Timeframe:
This timeframe is currently showing a correction. However, it's not yet considered a downtrend because the WMA45 is still in the high region, close to the 70 level. But, RSI has dropped below the WMA45.
At present, the RSI on H4 is facing dynamic resistance from the WMA45 above and has support around the 4x level (43-48). The corresponding temporary price levels are approximately 3128 (resistance) and 3088 (support).
This end-of-uptrend correction on H4 could lead to high price volatility. GOLD may move within a 300–400 pip range (between the resistance from WMA45 and the RSI support around the 4x zone).
H1 Timeframe:
Currently in a downtrend, as RSI is moving below both of its MAs, and the WMA45 has a noticeable downward slope.
H1 also has RSI support at the 30 level (temporary price ~3086) and resistance at WMA45 above (temporary price ~3130).
Since we’re focusing on intraday trading, priority is given to the H1 trend.
Figure 1
Trading Plan: SELL
Entry Zone:
When RSI on M15 approaches upper resistance: levels 50–55 or 65–70.
Confirm Entry:
Conservative/Safe approach: when M5 ends its uptrend and reverses (see example in Figure 1 – M5 ends uptrend when RSI crosses below both MAs).
Or when bearish divergence appears on M5.
Or even earlier, when there’s divergence on M1 and M5's WMA45 flattens out.
Stoploss:
20–30 pips above M5’s recent peak.
Or if RSI on M5/M15 breaks through its previous high.
Take Profit:
100 pips or R:R >= 1:1.
Or when M5’s downtrend ends (when RSI crosses above both MAs).
You can check out the indicators I use here: www.tradingview.com

BTC 4H setup : Potential Long Opportunity
Trade Setup: Long (Buy) Position
📍 Entry:
Look for an entry between 85,500 - 86,300 USDT once the 4H RSI shifts back upward.
Price is currently testing the 200 MA as support, a potential bounce zone.
The 1H RSI is upward but likely to dip slightly before aligning with the 4H timeframe for a buy signal.
The dotted resistance line should be watched for confirmation.
🛑 Stop Loss:
If price breaks and closes below 85,000 USDT, cancel the trade.
Suggested stop loss around 84,700 USDT to manage risk.
🎯 Take Profit Targets:
88,500 USDT (previous resistance)
89,800 USDT (recent high)
📌 Trade Considerations:
Wait for the 4H RSI to cross into the buy zone before executing the trade.
Use the 12-hour chart for confirmation before entering.
Lower timeframes (15M, 1H) can refine the entry for an optimal position.
📢 Disclaimer: This analysis is for informational purposes only and does not constitute financial advice. Trading involves risk, and past performance is not indicative of future results. Always conduct your own research before making any decisions.

BTC 4h Trade Setup: Potential Long Opportunity
Use the 12-hour chart for additional buy confirmation. For optimal entry, refine your position using lower timeframes.
Trade Setup: Long (Buy) Position
📍 Entry:
Enter around 80,800 USDT or 81,800 USDT in the next few hours.
A recent BUY signal and RSI near oversold territory suggest a potential reversal.
🛑 Stop Loss:
Set a stop loss below 80,000 USDT, around 79,500 USDT, to limit downside risk.
If the price breaks below 80,000, the next support is at 78,252.1 USDT.
🎯 Take Profit Targets:
1st TP: 86,500 USDT
2nd TP: 88,000 USDT
📌 This setup offers a favorable risk-to-reward ratio, with potential gains outweighing risks.
On the higher timeframe, the 21 EMA is still below the 50 EMA, indicating a prevailing downtrend. Trade cautiously and ensure you take profits accordingly.
📢 Disclaimer: This analysis is for informational purposes only and does not constitute financial advice. Trading involves risk, and past performance is not indicative of future results. Always conduct your own research and consult with a professional before making any investment decisions.

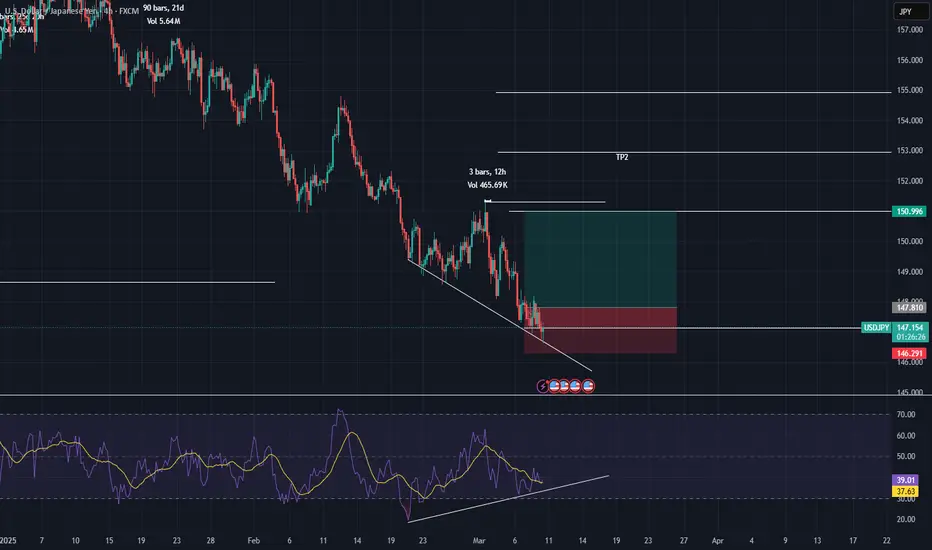
USDJPYI don't usually trade using the RSI strategy, but for some reason, I decided to take a look at it. What I found was a very strong divergence on the 4-hour timeframe, which has been developing over 72 candles—a significant number. Based on this, I expect this candle to be the reversal candle signaling an upward move toward the targets mentioned above.
Trade safely
Catch Big Reversals Like a Pro Using the GOLDEN RSIHow to Catch Market Tops and Bottoms Using the GOLDEN RSI Indicator
Trading market reversals can feel like a daunting task. But what if you had a secret weapon to help you identify tops, bottoms, and potential reversals with ease? Enter the GOLDEN RSI Indicator—a custom-built tool designed to revolutionize your trading strategy. In this tutorial, I’ll show you how to leverage this powerful indicator to spot reversal trades like a seasoned pro.
What is the GOLDEN RSI Indicator?
The GOLDEN RSI builds on the traditional RSI (Relative Strength Index) by adding optimized zones and visual signals that highlight potential bullish and bearish reversals. Unlike the standard RSI, which requires subjective interpretation, this indicator provides precise entry and exit signals by visually marking key market conditions.
How to Use the GOLDEN RSI to Catch Market Reversals?
Understand the Key Zones:
Overbought Zone (Above 80): Signals a potential market top or reversal from bullish to bearish.
Oversold Zone (Below 20): Indicates a potential market bottom or reversal from bearish to bullish.
Neutral Zone (60-40): Consolidation phase where trends are less decisive.
Spotting Bullish Reversals
When the RSI dips into the oversold zone (below 20) and begins to reverse upward, the GOLDEN RSI will highlight a Bull signal. This suggests a potential upward move, ideal for long trades.
Pro Tip: Look for confirmation with price action, such as a bullish candlestick pattern or a break of resistance.
Spotting Bearish Reversals
When the RSI climbs into the overbought zone (above 80) and starts to turn down, the GOLDEN RSI will mark a Bear signal. This indicates a potential downward move, perfect for short trades.
Pro Tip: Combine with chart patterns like double tops or bearish engulfing candles to strengthen your confidence in the trade.
The Hidden Power of Divergences
Bullish Divergence: Price makes lower lows while the RSI makes higher lows. This signals potential bullish momentum.
Bearish Divergence: Price makes higher highs while the RSI makes lower highs. This signals potential bearish momentum.
The GOLDEN RSI visualizes divergences clearly, so you can spot them effortlessly.
Use Risk Management Tools
Set stop-loss levels below recent swing lows (for bullish trades) or above recent swing highs (for bearish trades).
Use risk-reward ratios of at least 1:2 to maximize your profit potential.
Real Trade Example Using GOLDEN RSI
In the SPX 15-minute chart above, the GOLDEN RSI accurately identified:
A Bearish Reversal near the market top, as the RSI entered overbought territory and started to fall.
A Bullish Reversal as the RSI dipped into the oversold zone and recovered upward.
These signals allowed for precise entry points, minimizing risk and maximizing rewards.
Why the GOLDEN RSI is a Game-Changer
Unlike generic RSI tools, the GOLDEN RSI is designed with traders in mind. It eliminates the guesswork by providing visual cues for market reversals. Whether you’re trading stocks, indices, or crypto, this indicator is a must-have in your toolkit.
How to Get the GOLDEN RSI Indicator?
Want to try it for yourself? Head over to TradingView and add the GOLDEN RSI Indicator to your chart. Use it alongside your favorite price action strategies to take your trading to the next level.
Conclusion
Reversals can make or break a trader’s portfolio. By mastering the GOLDEN RSI, you can confidently spot market tops, bottoms, and reversals with precision. Start using this custom indicator today and watch your trading results improve dramatically!
Don’t forget to like, share, and follow me on TradingView for more tutorials like this one. Let’s catch those reversals together!

Tesla Hits New Highs! Will Santa Bring a $500 Gift for Xmas?Tesla’s stock is delivering holiday cheer, hitting an all-time high of $436 just in time for the season. Analysts are buzzing about where Santa might steer this EV sleigh next. Using the Fibonacci retracement tool, the 161.8% extension suggests a gift-wrapped target of $571.93 , while the trendline forecasts a cozy $490-$530 range by New Year’s Eve.
But wait, there’s more in the stocking! Tesla’s breakout was accompanied by high trading volume, like elves working overtime in the workshop. Meanwhile, the RSI is sitting at a frosty 78, suggesting Tesla might need a pullback before flying higher. Analysts are chiming in, with some predicting $472 and others dreaming of even higher targets for 2025.
If things go the other direction, keep an eye out for the $390-$400 range for key support. A break below this could mean Christmas is canceled.
Will Tesla soar like Rudolph or will Jack Frost be nipping at investor's hopes? Only time will tell, but one thing’s for sure: Tesla is the star atop this year’s stock market tree. Keep your eyes on the chart for more festive moves!
Let's sleigh the stonk market together! For more analysis and chart trends subscribe and launch that 🚀 to new all time highs!

Nifty RSI Super-Heated to 83% - Crash Coming ????On the Quarterly chart - the RSI indicator on Nifty is showing a value of 83% or more indicating it's in Over Bought Zone
Back in Jan 2008, the RSI went to a high of 87% and Nifty subsequently crashed -52% from the Highs. After 16 years, the RSI on Nifty is climbing up beyond the 83% mark which indicates "Danger of a Correction" according to many Expert Analysts from Media Channels, Twitter and Telegram
Please forward the below analysis to All those Pessimistic Technical Super-Zeroes
--------------------------------------------------------------------------------------------------------------------
I say - What a "Ridiculous" Comparison of 2008 vs 2024??? The entire Technology world looks toward India as a Hub of Technical Brains, but those brains are just filled with Age-old Folklores and Pessimism.
Technical Analysis is NOT a Geometry class to connect 2 dots from 20-30 years ago and say we had the similar situation back then and there was a Crash and the same thing will Repeat now. The entire market Dynamics has changed a lot.
1. First of all what's an Indicator?
An Indicator is nothing but a Human written Algorithm (A Script) which consumes Buyers & Sellers Activity and volume of trades historically and does some simple "math". How does this Dumb Number Crunching algorithm understand external factors?
2. What Really Caused the fall in 2008?
Think again closely - The 2008 crash was a Global Catastrophe caused by the Massive Conspiracy and Bankruptcy of Lehman "Buggers" (Brothers) in US which had a world wide impact. For those Technical Pundits who believe 2008 fall was due to RSI - read the Analysis below fully
In this image - there is a comparison of Nasdaq Vs Nifty 50 between 2000 to 2008 and the RSI line is that of Nasdaq (not Nifty)
In 2000, the market fell so badly in US and the RSI was around 98%. But in 2008, look at the RSI - it was hovering around the Healthy 60% mark which is treated as the Golden Levels of "Fresh Entry" by most technical analysts
But US & the entire world crashed in 2008 due to Lehman Brothers issue - As the subprime mortgages underlying these securities began to default at alarming rates, investor confidence plummeted leading to a loss in trust in Lehman Brothers. Unable to fully recover all of their losses, Lehman Brothers were forced to file for bankruptcy
Nifty was trading at RSI 90% back then, but US was trading at 60% RSI. So the fall here is NOT because of Indian RSI - but due to a Global event.
RSI is like a Speedometer - it just indicates that you are driving at 80 / 100 and in every vehicle speedometer - there will be a RED zone which indicates Dangerous driving conditions. Does not mean, the Engine will fail. It just says that driving so fast is not safe.
We should learn to do a Full Analysis - not just a Half-baked one connecting some dots with something else claiming Technical superiority
Nothing is going to happen to US especially NOTHING will every happen to Indian Market until Apr 2028 where Nifty will face a 34 year long Parallel Channel Resistance as indicated in the main chart
Disclaimer:
Stocks-n-Trends is NOT registered with SEBI. We do not provide Buy / Sell recommendations - rather we provide detailed analysis of how to review a chart, explain multi-timeframe views purely for Educational Purposes. We strongly suggest our followers to "Learn to Ride the Tide" and consult your Financial Advisors before taking any positions.
If you like our detailed analysis, please do rate us with your Likes, Boost and share your comments
-Team Stocks-n-Trends

Head & Shoulder pattern in Auto Axles. Auto Axles has been corrected from 2449 to 1860 by forming Lower High and Lower Lows. Price has been reverted from supply zone (1730 - 1800) on weekly time frame. It has formed higher high recently showing possibility of trend reversal and has also formed Head & Shoulder pattern on daily time frame and current price is near to neck line of H&S pattern, Having possibility for uptrend move. Share is trading below 200 D SMA.
CMP - 1866
RSI - 51
Entry price - 1885
Target price - 2070 (around 10%)
SL - 1790 (5%)
Disclaimer - This is for education purpose only. I am not a SEBI registered analyst. Take advise from your financial advisor before investing.

RSI Indicator LIES! Untold Truth About RSI!
The Relative Strength Index (RSI) is a classic technical indicator that is applied to identify the overbought and oversold states of the market.
While the RSI looks simple to use, there is one important element in it that many traders forget about: it's a lagging indicator.
This means it reacts to past price movements rather than predicting future ones. This inherent lag can sometimes mislead traders, particularly when the markets are volatile or trade in a strong bullish/bearish trend.
In this article, we will discuss the situations when RSI indicator will lie to you. We will go through the instances when the indicator should not be relied and not used on, and I will explain to you the best strategy to apply RSI.
Relative Strength Index analyzes the price movements over a specific time period and displays a score between 0 and 100.
Generally, an RSI above 70 suggests an overbought condition, while an RSI below 30 suggests an oversold condition.
By itself, the overbought and overbought conditions give poor signals, simply because the market may remain in these conditions for a substantial period of time.
Take a look at a price action on GBPCHF. After the indicator showed the oversold condition, the pair dropped 150 pips lower before the reversal initiated.
So as an extra confirmation , traders prefer to look for RSI divergence - the situation when the price action and indicator move in the opposite direction.
Above is the example of RSI divergence: Crude Oil formed a sequence of higher highs, while the indicator formed a higher high with a consequent lower high. That confirmed the overbought state of the market, and a bearish reversal followed.
However, only few knows that even a divergence will provide accurate signals only in some particular instances.
When you identified RSI divergence, make sure that it happened after a test of an important key level.
Historical structures increase the probability that the RSI divergence will accurately indicate the reversal.
Above is the example how RSI divergence gave a false signal on USDCAD.
However, the divergence that followed after a test of a key level, gave a strong bearish signal.
There are much better situations when RSI can be applied, but we will discuss later on, for now, the main conclusion is that
RSI Divergence beyond key levels most of the time will provide low accuracy signals.
But there is one particular case, when RSI divergence will give the worst, the most terrible signal.
In very rare situations, the market may trade in a strong bullish trend, in the uncharted territory, where there are no historical price levels.
In such cases, RSI bullish divergence will constantly lie , making retail traders short constantly and lose their money.
Here is what happens with Gold on a daily.
The market is trading in the uncharted territory, updated the All-Time Highs daily.
Even though there is a clear overbought state and a divergence,
the market keeps growing.
Only few knows, however, that even though RSI is considered to be a reversal, counter trend indicator, it can be applied for trend following trading.
On a daily time frame, after the price sets a new high, wait for a pullback to a key horizontal support.
Your bullish signal, will be a bearish divergence on an hourly time frame.
Here is how the price retested a support based on a previous ATH on Gold. After it approached a broken structure, we see a confirmed bearish divergence.
That gives a perfect trend-following signal to buy the market.
A strong bullish rally followed then.
RSI indicator is a very powerful tool, that many traders apply incorrectly.
When the market is trading in a strong trend, this indicator can be perfectly applied for following the trend, not going against that.
I hope that the cases that I described will help you not lose money, trading with Relative Strength Index.
❤️Please, support my work with like, thank you!❤️

A better DCA strategy that you need to start using. We all know about Dollar Cost Averaging positions over time.
However allow me to introduce you to a weighted DCA strategy that gets you a tighter average and retains additional capital over time ready to be allocated at "better prices".
First take your monthly $ allocation to your desired Ticker
*For this example we use $400 added monthly and TSLA as the Ticker
We break the monthly add into 1/4ths
So if we have $400 That = 4 lots of $100 dollars.
Set an Auto buy to $100 (as well as auto div reinvest if there is one)
*This feels like we're leaving too much on the table and not invested, but this is what gives this strategy the sauce.
*We use the Daily chart over a year timeframe for consistency.
If RSI is >= 60 we leave the auto buy of $100 (1/4) as is and save the remaining 3/4s to allocate at another date.
If RSI is >= 50 -60 we buy another 1/4 ($100) (totaling $200 or 2/4s of monthly allocation)
If RSI is <= 30 we allocate the other 3/4s ( $300 ) for a full 4/4s monthly allocation
_We will also @ RSI <= 30 allocate 1/4 of all saved monthly allocations
As seen in the Chart this occurs in Feb of 2024 where we buy $400 ($100 auto buy + $300 manual) and from $1300 reserves we've accumulated we use $325 to purchase additional shares.
This leaves us in great shape, we have a much tighter avg while also maintaining funds ready to specifically purchase more shares at a better price without the fomo.
The monthly breakdown of DCA'd shares looks like this
Shares DCA'd
Jul .35
Aug .789
Sep .794
Oct .773
Nov 1.94
Dec .84
Jan .84
Feb 3.90
mar 1.06
Apr 1.225
may 1.109
Jun 1.13
14.75 shares over 1 year
Total Invest
$3025
AVG/Share
$205 (9% better Avg than regular DCA)
W/ $1775 available for RSI < 30 situations
Any questions/ opinions welcomed.
Good Luck out there.

[BTCUSD] - EXPANSION! 🔸in daily chart can notice a power of 3 (Accumulation ,, manipulation ,, Expansion)"
🔸we are in stage 3 (expansion) accordibg to my vision..
that matching so likely with RSI indicator...(breaking out multi-month trendline)
🔸must be considerd that the price breaking out a POC line with large green candle too
🔸price now testing the 0.618 fib (golden level)
🔸so that... need a daily close above the golden level and u will watch new ATH for BTC.
appreciating for supporting us with ur like and hit "follow" for more updates🎯

BITCOIN Bull Penannt BREAKOUT! Here's Bull / Bear Scenario NextHuge Bull Pennant BREAKOUT today for #Bitcoin !
Massive VOLUME coming with the move and
price closed above 50MA
The RSI looks GREAT and I'm leaning Bullish, but here's a Bull & Bear scenario for the next couple months
CRYPTOCAP:BTC coming up to critical resistance at $67,3
If we can close a few days above that level we'll range ~$69,6
Then retest $64,6 once more...
That will be another critical level to smash past
Another few weeks of range and we blastoff to $80k mid-Summer 👑

CRYPTOHOPPER WEBHOOK PEPEUSDT 45MIN RSI WITH CONDITIONS STRATEGYRSI Strategy with EMA and VWMA Conditions
Objective
This trading strategy leverages the Relative Strength Index (RSI) in combination with the Exponential Moving Average (EMA) and the Volume Weighted Moving Average (VWMA) to identify potential buy and sell signals for trading cryptocurrencies on the Cryptohopper platform.
How it works:
Buy Signal: A buy signal is generated when the RSI crosses above the user-defined lower threshold and the EMA (9) is above the VWMA (20).
Sell Signal: A sell signal is generated when the RSI crosses below the user-defined upper threshold.
Indicators Used:
RSI: A momentum oscillator that measures the speed and change of price movements.
EMA (9 period): A moving average that places a greater weight and significance on the most recent data points.
VWMA (20 period): An average that also accounts for volume, giving more weight to periods with higher volume.
How to Set Up Alerts for Webhooks:
To create alerts that can be sent as webhooks to Cryptohopper, follow these steps:
Apply the script to your TradingView chart.
Click on the 'Alerts' icon on the right-hand side toolbar.
Choose the script from the dropdown in the 'Condition' field.
You will see two options: "Buy Alert for Webhooks" and "Sell Alert for Webhooks".
Select the desired alert condition.
In the 'Options' section, set the alert action to 'Webhook URL'.
Enter your Cryptohopper webhook URL into the 'Webhook URL' field.
Configure the alert message according to the format required by Cryptohopper.
Save the alert.
How Alerts Are Generated:
The script will continuously monitor the chart based on the conditions you've set.
When a condition for either a buy or sell signal is met, TradingView will trigger the alert.
If set up for a webhook, TradingView will send an HTTP request to the specified webhook URL with the message payload.
Disclaimer:
This script is for educational purposes and should not be taken as financial advice. Trading cryptocurrencies carries a high level of risk, and you should do your own research or consult a financial advisor before making any investment decisions.

Detection of Peaks and ValleysExplanation:
Detection of Peaks and Valleys: Initially, the RSI (Relative Strength Index) is calculated based on a selected price source. Then, any change in RSI that exceeds the specified percentage threshold is considered a peak or a valley point. These points are visually represented on the chart with green and red triangles.
Identification of Divergences: Differences between peak and valley points are examined. A negative divergence occurs when peak values increase on the price chart while decreasing on the indicator chart. Conversely, a positive divergence occurs when valley values decrease on the price chart while increasing on the indicator chart.
Generation of Buy and Sell Signals: When a negative divergence is detected, a sell position is opened and held until the specified take profit level is reached. Similarly, when a positive divergence is detected, a buy position is opened and held until the specified take profit level is reached.
This strategy utilizes the RSI indicator to assess the momentum and strength of price movements and generates buy and sell signals based on the detection of divergences. Parameters such as take profit levels and others can be adjusted by the user.
03:17:46 'Divergence Strategy 1' saved.
03:17:46 Compiling...
03:17:47 Compiled.
03:17:47 Added to chart.

OXY - a bullish setup for the agesOXY is on the verge of breaking through a major resistance line which was first touched over a decade ago. As the daily chart repeatedly bumps up against, but not crossing, this key resistance line, multiple factors make OXY a screaming buy.
