Rsr

RSR | Near the 0.1$ critcal level price is trending in contraction and soon to be expanded, I would like to see a daily candle close above the critical level of 0.1$ to confirm the high probability of expanding furthermore toward 0.5 level, notice that the price might get aggressive after breaking the 0.1$ and do not consolidate in 0.5$ area but to go directly to 2$ level ,, however , in this setup holding to 2$ if the price gets aggressive will be a good strategy,,


RSR Price in Bullish PennantRSR cryptocurrency the giant crypto currency and best investment project price is now at the moving in the bullish pennant
RSR cryptocurrency coin chart looks really good bouncing off the support zone and also at the trend line support.
Breakout above the 0.09 USDT it can move higher after the breakout


Reserve Rights RSR price prediction for March 2021RSR is expected to trade at an average of $0.17 by the end of March.

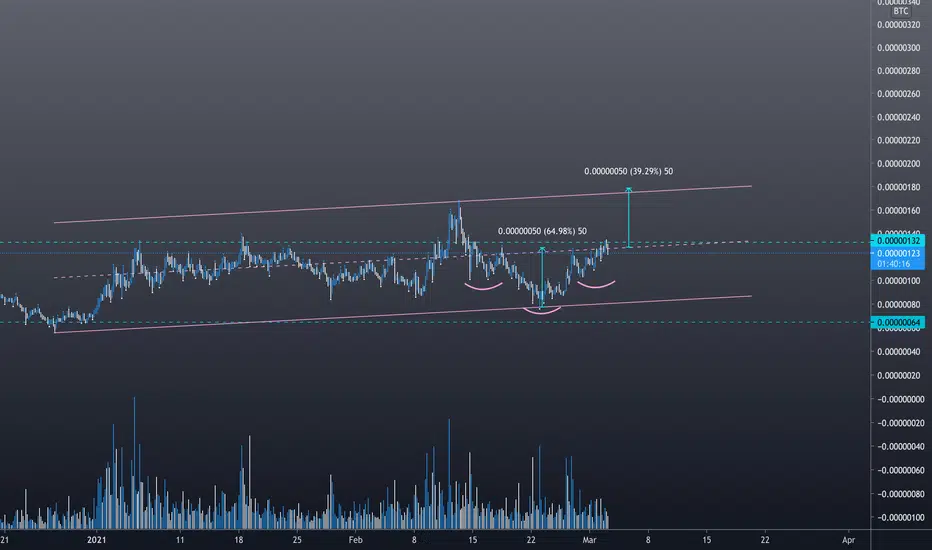
$RSR, Looking good w/ a potential R/S flip over ~140 sats level.$RSR
Looking good w/ a potential R/S flip over ~140 sats level..
If volume starts flowing in, looking for continuation toward ~180 sats (40%)
UCTS Signalling buys on the 2D and any lower timeframes..
#RSR

Reserve Rights (RSR) Full Chart Mapped With TargetsReserve Rights (RSRBTC) has been in a bullish trend since the year started, right after the late December 2020 low was hit.
We can see the three 3 wicks, 3 heads pattern, which is similar to the iH&S... When we see this pattern, we tend to end up with higher prices.
We have a bullish MACD and RSI and prices moving above all the EMAs and also the green volume rising.
There has been consolidation for long, but with the entire altcoins market now going bullish... It is only a matter of time before it is the Reserve Rights turn.
Additional details on the chart.
Leave a comment.
Namaste.

Is RSR/USDT ready for it's next leg up?I've been trading in and out RSR/USDT since . 01 and it is the gift that keeps on giving.
I am shitcoin_rich. I'm just some guy who made it in 2017 and gave a lot back to the market in 2018 and 2019, but, I learned a lot of great lessons and nuances of the alt market. My TA is meant to be simple, no gann fann's and fib circles. A few alt coin trading tips. I trade with EMA's as my baseline with price action as my basis for exact entries. I use fibonnaci/ market geometry/ indicators/ divergence for confluence on my entries/ exits. I am the farthest thing from a financial advisor.
1) When BTC is trending bearish , alts are mostly bearish .
2) When BTC is trending bullish , alts are mostly neutral or bearish .
3) When BTC is consolidating, alts are most neutral or bullish .
4) After a BTC bull trend, and moves into short to mid term consolidation, money almost ALWAYS moves into alts.
5) Alts follow Ethereum's macro trail mostly. Ethereum follows BTC's macro trail mostly.
6) If you trade alts with bearish momentum for Bitcoin or Ethereum , odds are you will lose.
BTC is King. Ethereum is queen. Alts are volatile peasants.
Trade Alt coins when BTC and ETH have bullish and/or sideways conditions.
RSR/USDT put in the daily high on Feb 13th, and the daily swing low on Feb 23rd, and has broken market structure to the upside on March 9th . Some technical observations, especially regarding the Feb 23 low.
- The February 23 low tagged the macro .618 fib extension and reacted bullishly. The low also wicked bullishly with a hanging man candle into a weekly order block. The reaction of the low put in a close of a higher high. And lastly the low tagged the Daily 55 EMA and moved bullishly away.
- Subsequently we have put in a higher high at .083 cents and I am looking for a support/ resistance flip at the .067 local high. If that area (local . 618 retracement / 6hr 55ema) holds, I am forecasting the next leg up to .13
I am bullish on RSR's fundamentals and expect it to reach .50 and maybe even 1.00 this year IF BTC and ETH hold bullish macro market structure.
And remember! Don't over risk! DYOR! Have a trading plan!

RSR is going higher!The pattern still needs to be confirmed as well, but at the moment, we can state with a high degree of confidence the reliability of such forecast.
This token is already in the public eye and about a week ago Grayscale Investments announced adding RSR to the pool of assets under its management.
In the circumstances of general bullish sentiment, We observe the correction which gaining distinct features of an Inverse Head and Shoulders bullish pattern, with a bullish moving average crossover. So we can wait and try to catch up with the trend tomorrow, or We can lead it today!
Our profit-taking levels: $ 0.09 and higher.


🔥 RSR Channel TradeRSR has been inside this channel for almost three weeks now, seeing some quite decent returns during that time. This trade is based around the idea that the channel will hold.
Since the short term trend is edging bearish, we'll place our Entry point around the area where I'd expect the price to touch the trend. Wait for the price to touch the entry line before entering.
On the chart I’ve marked two potential areas of resistance, R1 and R2. These areas are based on recent swing highs and round numbers. Do your own due diligence.
Happy trading!


RSR MIGHT RETEST TO 0.067 ZONERSR may revisit the 0.067 zone for the healthy retracement. We've been see this gem recently a good price action, but in a healthy market there's no such thing that is full vertical pump healthy correction occurs after a pump.
Price target are shown inside this chart. Thank me later.

RSR short term price targetEach time RSR has broken through resistance at its local ATH, it has rallied 52%, 86%, and 58% respectively.
I expect to RSR to reach $.18 and $.128 during this current rally


RSR: +100% pumping incomingThe RSRUSDT is moving in a log channel for a long time. Now it is heading to the upper band again, which is expected to be around 0.115 to 0.13 usdt range.
But be careful of the midline of the channel. The midline always played as a resistance/support in the history of RSR. Let's see if it breaks out.
MACD is golden crossed in the daily. RSI is moving strong.
We also have a nice Head&shoulders pattern, which is almost confirmed. The target of H&S is 0.9744.
I will take some profit at the upper line.


RSRUSDT BIG NEWS AND BIG MOVE !!!!!Head and shoulders bullish pattern in 4 H
I believe rsr go to 1 $


RSR 1H BUYAlso set some Buy orders near the Trendline
Remember no more than 5% of the deposit in one trade
SL: next sell signal

$rsr iHS$rsr currently showing a potential iHS on the bitcoin pair. daily close above channel EQ should trigger the rest of the move.