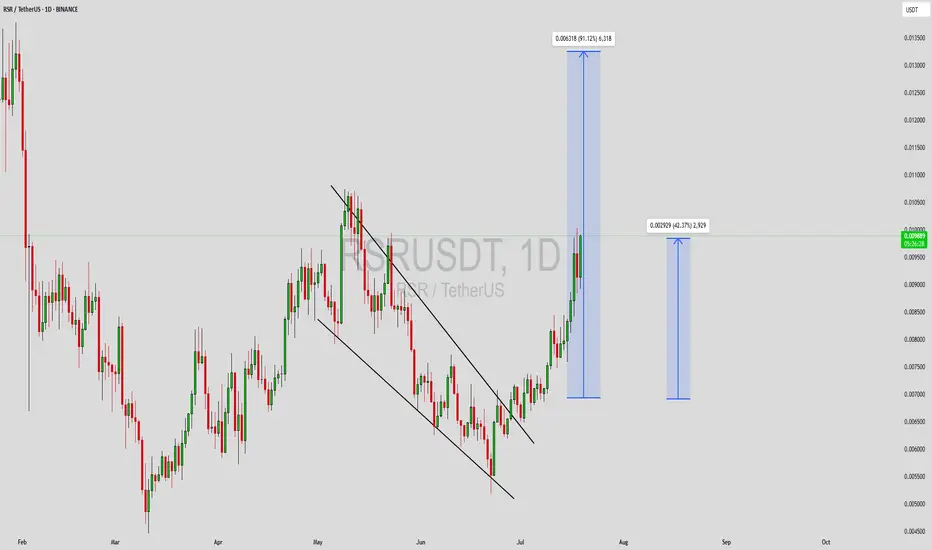
RSRUSDT Forming Bullish WaveRSRUSDT is exhibiting a clear bullish wave pattern on the daily chart, breaking out of its previous downtrend channel with strong momentum. This kind of technical setup often precedes a continuation rally, especially when paired with rising volume. The current breakout is supported by a steady increase in trading activity, indicating strong market interest and confidence from buyers. Based on this chart, there is potential for an 80% to 90% gain if the bullish structure continues to unfold as expected.
Reserve Rights (RSR) is a token with a unique use case, focused on stabilizing digital economies and supporting low-volatility assets. As crypto adoption grows in emerging markets, utility tokens like RSR are becoming increasingly relevant. This could be one of the reasons why investor sentiment is turning positive again, especially after a period of price consolidation and accumulation. If RSR can maintain its momentum, it may retest its previous highs or even reach new local peaks.
Traders and investors should watch key resistance levels closely while considering support re-tests for potential entries. The risk-to-reward ratio in setups like this tends to be favorable if volume remains elevated and broader market sentiment supports the move. Technical indicators such as RSI and MACD may also confirm the bullish bias in the coming sessions, further strengthening this setup’s credibility.
✅ Show your support by hitting the like button and
✅ Leaving a comment below! (What is You opinion about this Coin)
Your feedback and engagement keep me inspired to share more insightful market analysis with you!
Rsrusdtlong
RSR/USDT Breakout Play – Approaching a Major Reversal
🧠 Full Technical Analysis (Timeframe: Daily)
RSR/USDT is at a crucial decision point after months of consolidation.
The price action has been forming a classic Descending Triangle pattern, a structure that often precedes major breakouts or breakdowns. As we approach the apex of the triangle, RSR is now testing a descending resistance trendline that has capped prices since December 2024.
🟢 Bullish Scenario: Breakout Toward an Explosive Rally
If the price successfully closes above $0.0083 with strong volume confirmation, it could trigger a trend reversal and unlock a potential multi-phase rally.
🎯 Potential Bullish Targets:
Target 1: $0.0106 – Minor resistance and possible initial take-profit zone.
Target 2: $0.0122 – Last major distribution zone before the previous breakdown.
Target 3: $0.0170 – Strong historical resistance and psychological level.
Max Extension: $0.0259 – $0.0270 – Could be reached if the breakout gains momentum, potentially delivering over +200% upside from the current level.
📈A clean breakout could attract both retail and institutional buyers, leading to significant upside in the short to mid-term.
🔴 Bearish Scenario: Fakeout and Deep Correction Risk
If RSR fails to break out and gets rejected at the trendline resistance, we could see a pullback or bearish continuation. Key support levels to watch include:
🔻 Possible Downside Levels:
Support 1: $0.0072 – Current horizontal base of the triangle.
Support 2: $0.0060 – Previously tested demand zone.
Major Support: $0.0044 – Yearly low and strong bounce zone if panic selling occurs.
📉A rejection at the trendline could open up short-term downside of 30-40%.
🧩 Pattern Highlight: Descending Triangle (Breakout Imminent)
✅ Dynamic Resistance: Downtrend line from December 2024.
✅ Horizontal Support: Around $0.0070 holding firmly.
🚨 Breakout Approaching: Watch for a daily close above resistance.
📌 Confirmation: Breakout should be supported by increased volume to be valid.
🧠 Strategic Notes:
Always confirm breakout with volume and candle close.
Breakout setups like this offer high R:R swing trade opportunities.
Use proper risk management around key levels.
🔍 Conclusion:
RSR is facing a make-or-break moment after months inside a descending triangle. A breakout above resistance could ignite a powerful rally, while a rejection might trigger another wave of correction.
Breakout or Breakdown? The next few candles may decide everything. Stay ready.
#RSR #RSRUSDT #CryptoBreakout #DescendingTriangle #AltcoinSetup #TradingSignal #CryptoAnalysis #BreakoutPlay #CryptoCharts #CryptoTechnical

#RSR/USDT#RSR
The price is moving within a descending channel on the 1-hour frame, adhering well to it, and is on its way to breaking it strongly upwards and retesting it.
We are seeing a bounce from the lower boundary of the descending channel. This support is at 0.008441.
We have a downtrend on the RSI indicator that is about to break and retest, which supports the upward trend.
We are looking for stability above the 100 moving average.
Entry price: 0.008663
First target: 0.008776
Second target: 0.008922
Third target: 0.009093

#RSR/USDT#RSR
The price is moving within a descending channel on the 1-hour frame, adhering well to it, and is on its way to breaking it strongly upwards and retesting it.
We are seeing a bounce from the lower boundary of the descending channel, which is support at 0.007050.
We have a downtrend on the RSI indicator that is about to break and retest, supporting the upward trend.
We are looking for stability above the 100 moving average.
Entry price: 0.007100
First target: 0.007309
Second target: 0.007556
Third target: 0.007816

RSRUSDT 1WRSR ~ 1W Analysis
#RSR Buy gradually from here if you still have a Conviction on this Coin with a minimum target of 20%+.

RSR move to local resistance zoneBINANCE:RSRUSDT
✅Before we start to discuss, I would be glad if you share your opinion on this post's comment section and hit the like button if you enjoyed it.
Thank you.
Now almost all alts charts looks the same! top, one and half year downtrend line and bottom around more or less -0.18 and -0.27 zone by fib!
Everything on chart is D1 Timeframe
Possible Targets
➡️We possible passed the bottom and now in accumulation phase
➡️ Red box is first resistance zone where we can reject and come back down around September.
➡️ Already broke with retest on D1 timeframe downtrend line. I think we will see more than 150 days in accumulation phase before real reversal move and new cycle.
➡️Minimal targets for next year is 0.5 level by FIB
Hope you enjoyed the content I created, You can support with your likes and comments this idea so more people can watch!
✅Disclaimer: Please be aware of the risks involved in trading. This idea was made for educational purposes only not for financial Investment Purposes.
* Look at my ideas about interesting altcoins in the related section down below ↓
* For more ideas please hit "Like" and "Follow"!

RSRUSDT 1WRSR ~ 1W
#RSR Still in a bullish trend so far. If you still have Conviction on the coin,. Buy in stages from here. with a minimum target of 15%+

#RSR/USDT#RSR
The price is moving within a bearish channel pattern on the 4-hour frame, which is a strong retracement pattern
We have a bounce from a major support area in green at 0.004746
We have a tendency to stabilize above the Moving Average 100
We have a downtrend on the RSI indicator that supports the rise and gives greater momentum, upon which the price is based higher at the discount
Entry price is 0.004746
The first target is 0.006078
The second target is 0.06985
The third goal is 0.008128

RSRUSDT Cup and Handle Pattern!RSRUSDT Technical analysis update
RSRUSDT price formed a cup and handle pattern at the bottom. The price broke the cup and handle pattern's neckline resistance on the weekly chart, took around 900+ days for the breakout. If the price remains above the neckline in the weekly candle close, we can expect a bullish move in the coming days.

RSRUSDT 1WRSR ~ 1W
#RSR If you still have Conviction on the coin,. this support block would be a very good buying place for now. buy in stages. short term target of at least 20%++

RSRUSDT bouncing from monthly supportThe price shot up beyond monthly resistance MR1 only to come back down and retest it again where it was rejected and sent back down towards monthly resistance MS1. The price has bounced from MS1 after hitting it and weekly resistance is causing the price to pullback on this bounce. The price might still dip into MS1 before a stronger bounce in case this current pullback goes further deep. However, this monthly support is a strong one and will allow the price to bounce and continue its journey in upward direction, Therefore, I see the price moving beyond monthly resistance MR1 after having a brief pause and pullback there. Once it breaks MR1, it will target monthly resistance MR2 zone. Therefore, a long from MS1 is favorable for this asset at least for the coming months.

#RSR/USDT#RSR
The price is moving in a descending channel on the 12-hour frame, about to break upward
With a strong support area in green at 0.0045. The price has already rebounded from it
We have a tendency to stabilize above the Moving Average 100
We also have a downtrend on the RSI that has been breached upward
A moderate rise is expected over 3 levels
Entry price is 0.005800
The first target is 0.00645
The second goal is 0.007450
The third goal is 0.008790

RSR main price targetMain price target for BINANCE:RSRUSDT
Possible Targets and explanation idea
➡️Weekly fib. From 9 May 2022 we are around accumulation zone
➡️On money power indicator you can track blue column where mostly money inflow
➡️Lately we saw money outflow on W tf. Usually whales withdraw initial deposit
➡️Market Mood indicator all the time when you see grey zones its a capitulation
➡️First middle term target will be buy side liquidity level
➡️Next one is sweep EqHigh on W tf and zone of fixation % position
Hope you enjoyed the content I created, You can support with your likes and comments this idea so more people can watch!
✅Disclaimer: Please be aware of the risks involved in trading. This idea was made for educational purposes only not for financial Investment Purposes.
---
• Look at my ideas about interesting altcoins in the related section down below ↓
• For more ideas please hit "Like" and "Follow"!

RSRUSD 1WRSR ~ 1W
#RSR Make Purchases gradually in the Demand zone. with a minimum target of 20%+. This is a Support zone that needs to be retested for further upside.

#RSR/USDT LONG#RSR
The price has been moving in a descending triangle since April 2022
We have a strong support area from which the price rebounded
The downtrend of the triangle has been broken and we are about to go up
This rise is supported by the moving average 100 break of 100.
The price is now 0.002941
First target 0.005484
Second goal 0.008678

RSR will fly hardPrepare yourselfand DYOR
It' a TA not a financial advice
all are shown on the chart

Long trade setup for RSRUSDTFor the BINANCE:RSRUSDT.P Long Trade Setup, the following values are suitable for our interval trade:
Entry: 0.002760
Target: 0.002867
Stop: 0.002672
Cost Reduction: -
The profit is reasonable relative to the risk.

RSRUSDT Good Buy!RSRUSDT (12H Chart) Technical analysis
RSRUSDT (12H Chart) Currently trading at $0.00195
Buy level: Above $0.00195
Stop loss: Below $0.00183
TP1: $0.00204
TP2: $0.00225
TP3: $0.00255
Max Leverage 2x
Always keep Stop loss

Reserve rights Entry: 0.001963
Profit: 0.002167 (10.39%)
Stop: 0.001885 (3.97%)
Risk-To-Reward: 2.62
hello Traders, here is the full analysis for this pair, let me know in the comment section below if you have any questions, the entry will be taken only if all rules of the strategies will be satisfied. I suggest you keep this pair on your watchlist and see if the rules of your strategy are satisfied. Please also refer to the Important Risk Notice linked below.

Rsr bullish Rsrv is very bullish and chart is speaking by itself. Bullish tringular pattern breakout and succesfull retest done which can be good buy signal keep eye on it

RSRUSDTFolks Don't be panic seller we have a lot to achieve look on my chart my analysis and where is my target RSR has to go to the moon just you have to stay positive and just you have to wait want watch and yo can see my leverage and you have to sue low leverage too

Rsr | Breakout Rsrusdt
Horizontal Resistance Breakout Already Confirmed
Trying To Break Trendline In Case Of Successful Breakout Expecting 35-50% Bullish Move
Remember: We only give ldea's from our
experience and knowledge, it does not
mean that it will be 100% correct, the
market is always unpredictable, anything
can happen anytime.
Always trade with your own research and
knowledge. If You Are Satisfied With Our
Work Then Join.

RSRUSDTAS significant retest continues the rally of bull market, 1:3trade risk ratio use proper risk
