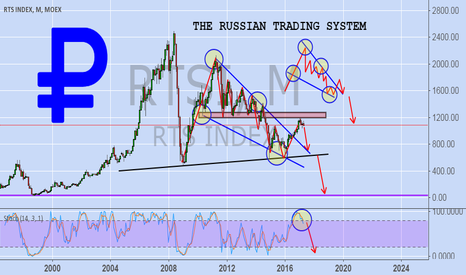
RTS
RTS index could drop to 800-530 following the Brent crudeThere will be no miracle. Less revenues from falling oil market will drag the index lower
as it should be around 800 already and could hit 530 when the oil would retest a multi-year low.
The correlation index for the past 12 months shows negative correlation but it is a temporary situation
as on the longer periods (20+ months) it is positive.
This will change gradually when the index will catch up with a falling "knife" oil.
RTS Index - Crisis?Form a triangle dictates the price to go down - to finish wave (e), followed by a rise.
However, it can turn out that the wave (c) of ((d)) will stretch and leave the upper edge of the triangle. Also, under certain circumstances, it may be impulse wave. But I consider this option as an alternative.
RTS intraday prediction.Hello Traders!
Suppose, the bullish impulse will continue.
Powerful Traders take a long position to 131000.0;
(The main invalidation for current price is 129046.0)
Subscribe to "Powerful Traders"!
Everyday, nine Tengri's traders, creates professional analysis, specializing on Elliotte wave theory, Technichal analysis,
Volume Spread analysis, Market Profile, Depth of Market, Order flow & Footprint.
We trade in all financial markets, there are no boundaries or limitations.
«« «« «« «« «« Hold Like! »» »» »» »» »»
(If you have questions, comments, write, reply thoroughly!)
You're welcome!!!
Best regards, the team Traders "Powerful Traders".
RTSI @ daily @ best index (of 55) 2016! While january`17 flat ?Take care
& analyzed it again
- it`s always your decision ...
(for a bigger picture zoom the chart)
This is only a trading capability - no recommendation !!!
Buying/Selling or even only watching is always your own responsibility ...
58 SHARE INDICES worldwide (2016 Yearly Performance) @ drive.google.com
Best regards
Aaron
Russian stock indices enjoy broad gains since Trump's electionMICEX (ruble denominated index of TOP 50 Russian shares) and RTS (US Dollar denominated) stock indices demonstrate a clear bullish rally since the US President Election Day, marked as vertical line on the charts.
The MICEX index has gained 14,2% since the election to date and 26,7% YTD; RTS performance is even more impressive with 17,7% and 50,9% rise, accordingly, thanks to RUB strengthening in the displayed period.


