watching for short entry in to Tzatry watching for a short entry on Tza
god it's annoying TV requires a lengthy description. These charts are time-consuming enough.
RTY1!

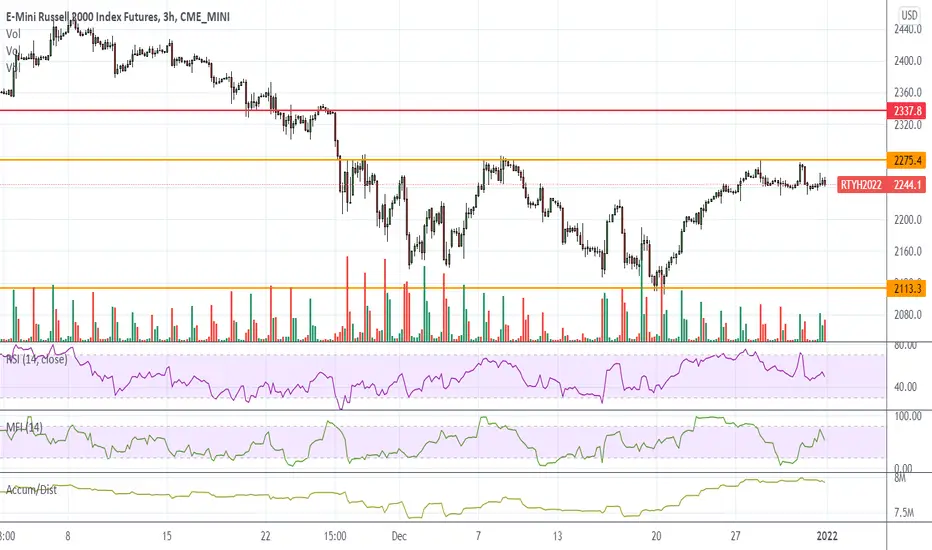
RTY UpdateMFI almost overbought, much like NQ
Don;t chase the pump, probably should be looking at cashing out soon if you;re long. I would not hold a long position over the weekend
There is the chance that RSI also need to go overbought but I wouldn;t count on it

Meanwhile, small caps...Small caps appear to be melting up, the index tends to fill gaps and there's a gap at my red line. Note that it's an index gap and not a futures gap so there's no guarantee on this one. Also, it's tagging along the overbought zone so it can tank at any time.
I'd stay away from garbage stocks though if you;re going long

Santa is still here! $SPY
looks like Santa is still here!
Cup & handle on futures playing out beautifully. As long as we hold above supply overnight I don’t see anything stopping us from making more all time highs tomorrow. Daily also looks amazing after consolidating and retesting the 9 EMA for continuation.
Wanna buy the dip if this retests and holds 4789-4784 above supply (9 EMA)
Swing targets above ATH for
$SPY: 480, 482, 485

RTY UpdateMFI hit overbought, market really seems to be having issues pumping small caps with futures. Could just be an EOY thing, we'll see next year
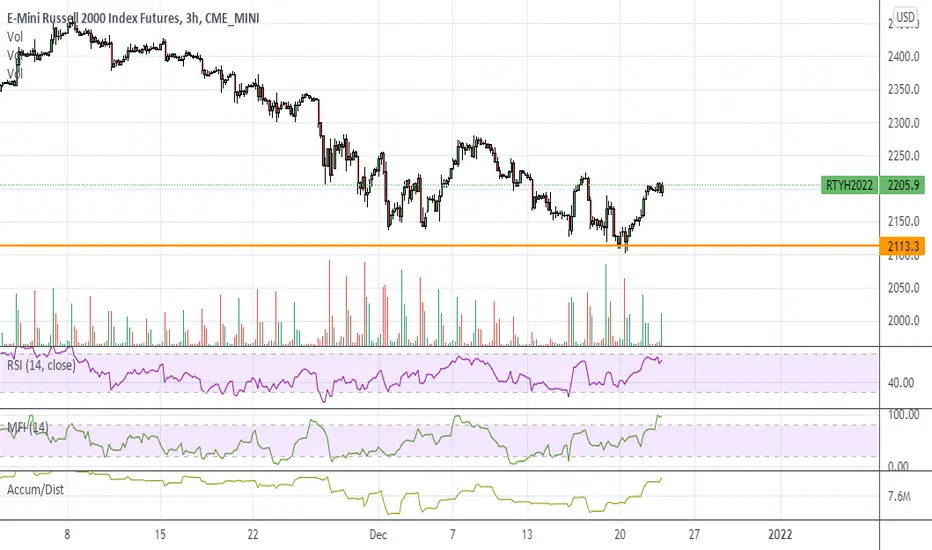
RTY UpdateOverbought on RSI with MFI divergence but I think it goes up until MFI gets overbought. Probably a 3 day pump and short squeeze again. (Just guessing at this point) Staying out until Monday afternoon. I'd rather short garbage than go long on them.
Gonna be a ton of short opportunities next year I think

Trading Range on Nasdaq 100 FuturesWe are in Trading Range on the Russell 2000 Index Futures.
Like and Comment will be hugely appreciated, thank you so much for your support.
See other ideas below too!
RISK DISCLAIMER:
Trading Futures ,Forex, CFDs and Stocks involves a risk of loss.
Please consider carefully if such trading is appropriate for you.
Past performance is not indicative of future results.
Always limit your leverage and use tight stop loss.

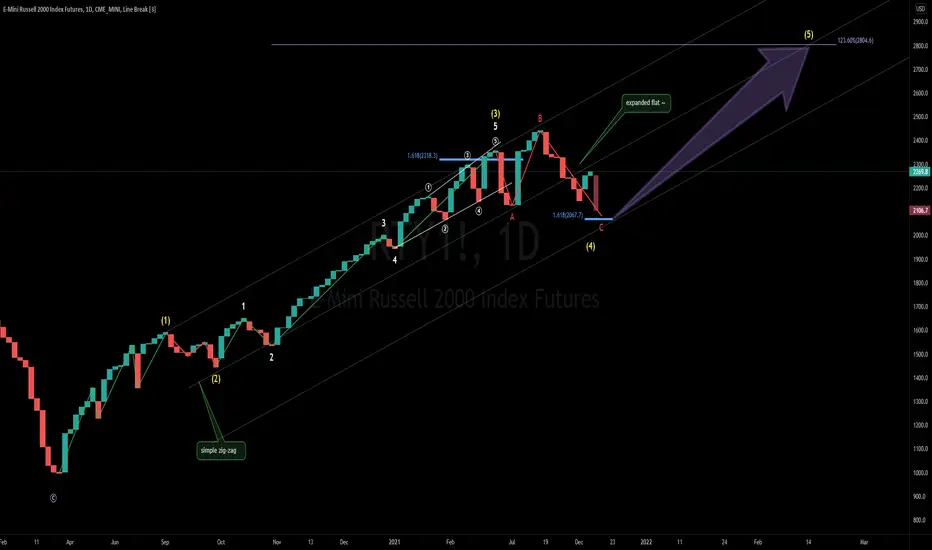
"most fear the unknown" iwm updatemost fear the unknown, and in turn they stay away from it,
i walk into the unknown with confidence, knowing there is always opportunity ahead.
----
iwm\rty (small caps) look to be on the verge of finding a big local bottom in this local region here through an expanded flat.
the law of alternation states: "if wave 2 was a simple zig-zag, then wave 4 will have to be a complex correction".
that's precisely what we're seeing here, a little complex correction phase to really shake out the weak hands out of this wicked market.
-----
wave 4 target = $2067.70
wave 5 target = $2800
RTY1!12.17.21 Russell 2000 . I do NOT like Pro shares! (reasons); The price dynamics that made the Russell a tough market to short when it made a new low.

NQ MFI OverboughtAll indices overbought on MFI, but not on RSI.
FDAX has yet to fill the gap above so I think the market gaps up again tomorrow. Probably a whipsaw day today though because they gotta sell of a bit to get MFI down. Also a chance of a melt up here, because that's what always happens after a selloff. Lots of stocks hit oversold on daily last week.

es\rty 12\3 update~good morning,
the bulls came in clutch in this last second to put in the fifth leg of a sloppy leading diagonal into wave (1) of a higher degree
this in my eyes confirms a break of downtrend, and the dip that comes is for buying.
expect a deeper dip than usual, as there is still very strong selling pressure, but don't be afraid of it.
i don't think we take out of the local lows.
dip might not come today, but i got a feeling we gonna get it sometime soon.

𝗦𝗺𝗮𝗹𝗹-𝗰𝗮𝗽 𝗨𝗽𝗱𝗮𝘁𝗲: $IWM Weekly. Fake Breakout?If support fails and confirms a fake breakout things could get ugly. One of the more important trendlines to watch!
$RTY_F $AMC $CROX $SPY $ES_F $QQQ $NQ_F $VIX $TLT $TNX $DXY #Stocks #Trading 📈

$RTY Russell 2k anchored VWAPMost important chart in the market today imo. VWAP anchored to yesterday's low bar provides the safety signal. Above it, buyable imo. Below, gtfo.

RTY1! Gold Oil12.1.21 RTY1! Gold Oil: On this video I compared three markets, one of them was contracted and the other two were volatile markets. You do not need to trade many markets to be profitable, but you need to avoid markets that are contracted and don't give you a sense of probability that is to your advantage. Contracted markets are more difficult to have a sense of probability unless they have a fairly well established range with enough distance between buyers and sellers, and that's what will allow you to have a better sense of probability because the vertical range is enough for you to make a decent profit. If you have too many markets that you need to focus on, this can be very counterproductive, and you can waste a lot of time in markets that are likely to deliver a decent risk reward. Most people don't really understand why they can trade profitably for a few weeks or a few trades, and that everything turns sour. They know it doesn't feel right, but they haven't conceptualized with the markets doing. It's a very well-known phenomenon that some traders can have very profitable periods of trading, and then a short time later lose almost all their games. It can be so disconcerting that they will go through cycles of changing their charts and their indicators, but they don't realize the broad difference between expanding markets and contracting markets. This can go on for years. Most traders who start trading, losing the markets, and stop trading. Bobby's Homework Assignment: study the last three or four videos and notice the difference between expanded markets and contracted markets. Make a note to yourself that even in parish markets, even prolonged bearish markets there will be periods of time where taking a long position will be very profitable. This is absolutely a fact. One reason this is important is that most traders are all or nothing, and they're either bullish or bearish, and there is no flexibility in their assessment and their ability to be flexible. Don't Be That Way!

RTY1!11.30.21 Russell 2000: Looking at market dynamics, opportunities for buyers and sellers. Time to start looking for buyers for a nice move higher.

RTY daily oversoldRTY oversold on the daily, but it still went down during the original COVID tank....
Indicators say buy here, but the other indices are not oversold yet. IWM chart shows the same.

iwm updatepreviously i discussed the requirement for iwm to break-out of the range it was in \ consolidate above it & hold to see continued upside for that final fifth wave.
we've broke out finally, but is this a real breakout, or is it just another trap?
i'd like to see it consolidate up here for at least another week before making any kind of decision.
if it could pull this off, we'll see small caps go parabolic for a bit.
----
20 year count 👇

Hustle in the RussellAnother straight forward idea, RTY came back into a very nice retracement area with the down sloping trend line and horizontal support from the September high. This is a great area to add for a bounce and a stop would be a daily close below today's low. The target is around the 2380 area, and if all goes well it should tag it before the end of the year.

20 year elliott wave analysis ($iwm)someone asked me this evening if i thought iwm was in a phase of distribution right now- so i decided to take a deep dive into the entire history of this chart, and here's what i've come up with.
no, i do not think it is in a phase of distribution, instead it actually looks like a massive bull flag - in elliott wave theory terms, i'll call it a double or triple three - hard to say for now, since it is only halfway through this flat corrective phase.
my low ball long term upside target for iwm is at $335, high ball would be $375
this is in confluence with my 12 year spy analysis, you can view it down below:
ps. flat corrections can take a really long time to resolve, so i'd wait for a definitive break out, and a retest of the entire channel that it's in right now before attempting to play that upside swing.

Russel 2000 Continuation TradeIn this update we review the price action in the Russell break out trade and identify the next high probability trading opportunity

RTY - possible tradeIt's a choppy friday.. Russell is holding up well.. looking for a break below to sort.. May decide not to take trade this late of Friday...

