ES MFI went oversold premarketES MFI went oversold pre-market as did RTY (small cap), NQ barely above oversold.
Flipped all my puts (EL, ABC, SFIX and KAMN). Made decent money this week. Staying out unless I see something good, probably a whipsaw day.
Much like yesterday, I'm inclined to believe the market is headed up after the gap fades a bit on profit taking.
RTY1!

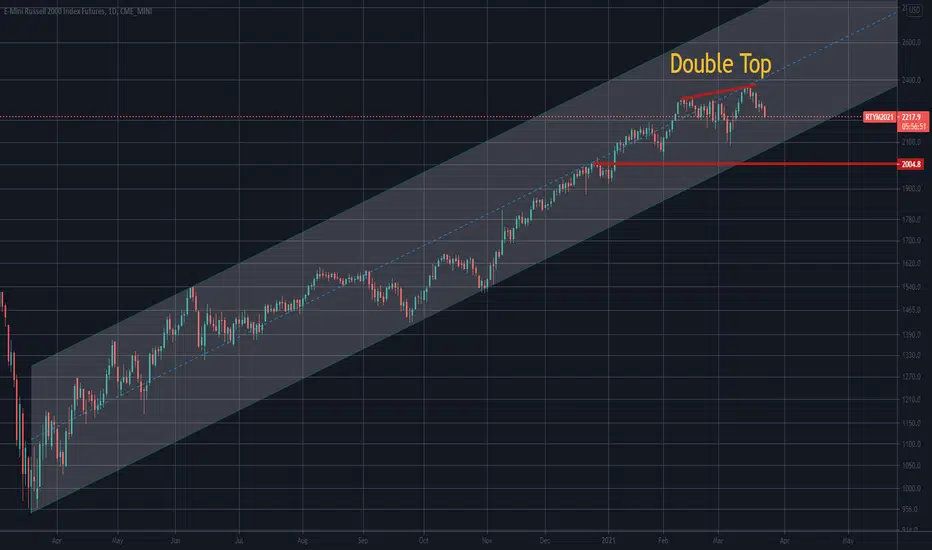
RUSSEL 2000 Market Breakdown Analysis!!Hi ,
Indexes are clearly bullish . Untill market shows the opposite reaction we should take consider the current momentum.
Now, we have to find a proper palce to get in the trend. If price tousch the key levels which referred in the charts, hopefully it will be great opportunity to take consider!!
In case of, H&S neckline will be broken, deeper correction can be considered!!
Note: the posts are not investment idea

Trade what you see, not what you think..A rare triangle pattern.. Leaning to a bullish approach if we could reclaim 2265 area.. Bearish if it breaks below 2210 area.. All in between = noise..

US2000 RUSSEL POSSIBLE HEAD & SHOULDERS !!!Hi,
There is a good opportunity, IF everything goes on what we see in the chart, to get risk/reward ratio on #US2000

RTY Update - Small Cap SellofThe selloff continues.... overlay says afternoon rally and/or gap up tomorrow, but I wouldn't go long until both MFI and RSI get oversold. I think it'll be a bull trap.

Russell 2000 Oversold: Look for dip buying tomorrowRTY has hit a key fib band level from which previous rebounds have occurred. The RSI is also at a level from which recent previous rebounds have occurred.
If ES holds 3880 in the Globex, I’m going long.
There's always the danger of a vertical drop given how full of trash (GME, AMC, PLUG, various SPACs) this index has become.

There is no Safe place Anymore..! Winter is coming...All the major indexes show bearish signs!!!
no matter what you are looking at NASDAQ, S&P 500, Dow Jones, Russell 200,3000..!
RTY: Buy the backtestAfter a successful day for the bulls, RTY has pulled back slightly to retest the fib line in the low 2240s. 2243 is a perfect place to enter a trade given it's very close to a fib stop loss (2241).
Combined with bullish action for BTC and Ethereum, the risk reward favors a long here.


JNK/TLT is screaming SHORTY RTY!JNK/TLT is my favorite indicator I have found. It tells me when to go long and when to short. And right now short RTY is probably the best short of the century. the green line has been an indicator of shorting rty I am going to start to build a position in RWM and will be planning to hold it for a large correction to becoming in RTY.

RTY Daily hit up Fib Extension. Expecting a pull backThe RTY daily time frame hit the up Fibonacci Extension and hitting resistance. These are big signs of a potential pull back. I am waiting for a lower price before looking for long opportunities.


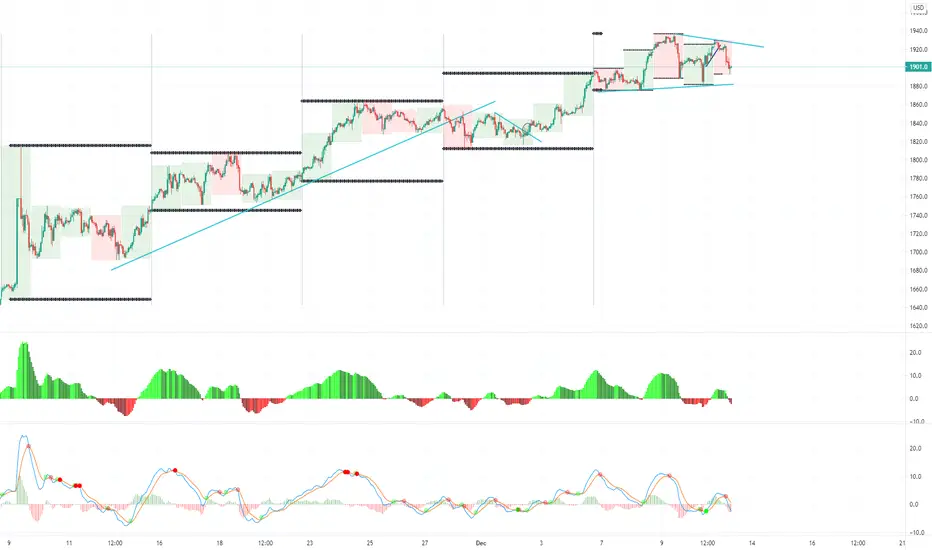
RTY One hour up ChannelRTY one hour time frame is breaking the counter trend line bullish off the one hour time frame. The top of the channel is around +500 Ticks above the support level.

$IWM RTY would be in trouble below 2100$IWM RTY would be in trouble below 2100
This week is a good week to play short if the momentum on the small cap index sells to the downside.


RTY One hour up ChannelRTY One hour time frame is in an up channel. I am looking for the market to form a low price and push bullish towards the top of the channel. The low price could be now or it could be near the bottom of support. It may be a good idea to use a counter trend line break bullish to find the potential low price.

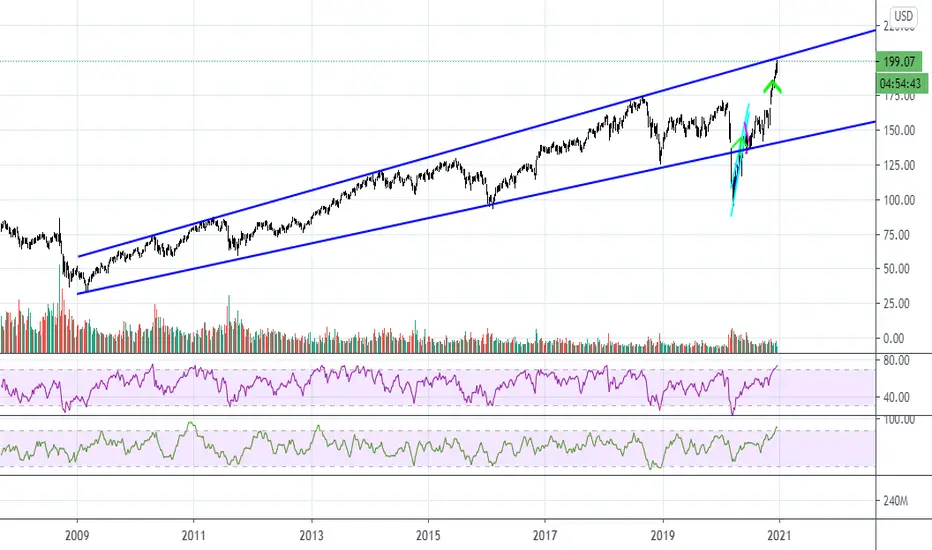
IWM Long Term ChartOverbought on every time frame, and it's sitting at my target.
Expecting a pullback, which means speculative stocks will also take a hit....
RTY1! at 200 Hullmalooks very tired.
Disclaimer, this is only for entertainment and education purposes and doesn't serve by any means as a buy or sell recommendation.
Personally I hold both long term long positions and occasionally short term short position, for disclosure purpose.


Russell 2000 future trendline Right at weekly trendline resistance now. Interesting to see what happens next.
Disclaimer, this is only for entertainment and education purposes and doesn't serve by any means as a buy or sell recommendation.
Personally I hold both long term long positions and occasionally short term short position, for disclosure purpose.

