Rty1

Russell 2000 Futures Headed To 2668?Exactly one year ago this month the Russell 2000 broke out to new highs and many were calling it the November to Remember as the RTY had an all-time record 18.4% monthly total return This November the Russell 2000 is also breaking out to new highs and on my strategy the look is exactly the same as last year. Will this be another November to remember? I think so, but I don't think it will be an 18.4% rally like last year. I do think that the RTY could rally 10% and look to test 2668 before the end of the year. I use Bollinger Bands with 20 period, 3 standard deviation settings along with a simple 10 period simple moving average on a weekly, daily and 60 min charts as my strategy for this long swing trade.

RTY UpdateThis is what I mean by pump and dump, look at the sell volume in the morning.
The algos have managed to convert futures trading into a pump and dump scheme and teh dip buyers are letting them make their money, lol. Small caps still flat despite the dump. Sideways action until the dip buyers are gone.
Watch MFI though, as soon as it goes oversold we'll see another pump

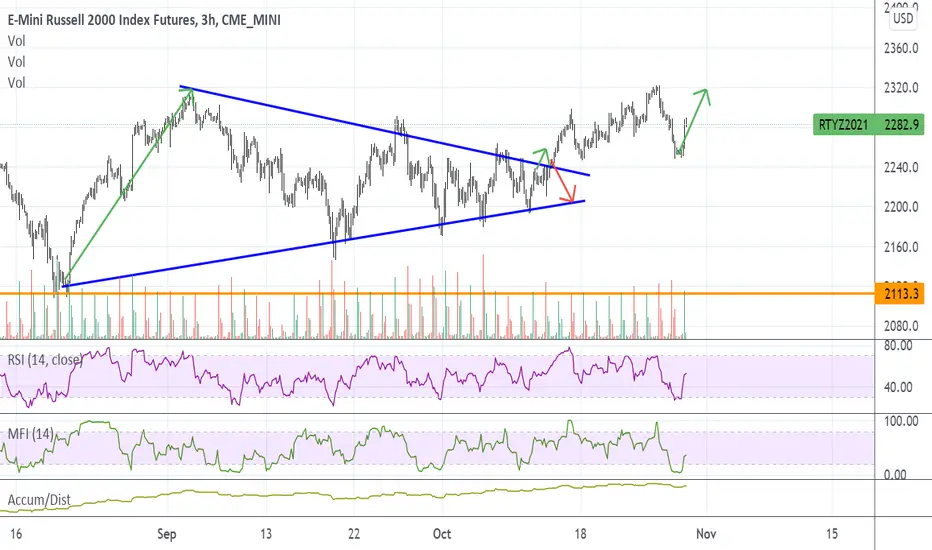
RTY1! (Russel 2000 fakeout or breakout) ? - Fakeout so far.(Opinion only)
Just a chart, think for yourself. :)

RTY longLong RTY
After consolidating of roughly 185 days, it looks like the RTY is ready for a nice break out
First target 3463 zone
Second target 2600 zone
Invalidation day close below 2284

RTY UpdateMFI went overbought as expected, but RSI didn't because of the indirect effect from AAPL and AMZN miss.
Could go either way Monday
Russell2000 Trading Wave 5 In this update we review the set up for a wave 5 extension in the Russell

RTY UpdateLooks to me like it wants to go overbought again. I told you guys yesterday it was oversold.
Small caps probably rally tomorrow since it's Ponzi Friday, ES and NQ direction will depend on AAPL and AMZN earnings, but I'm stating teh obvious.
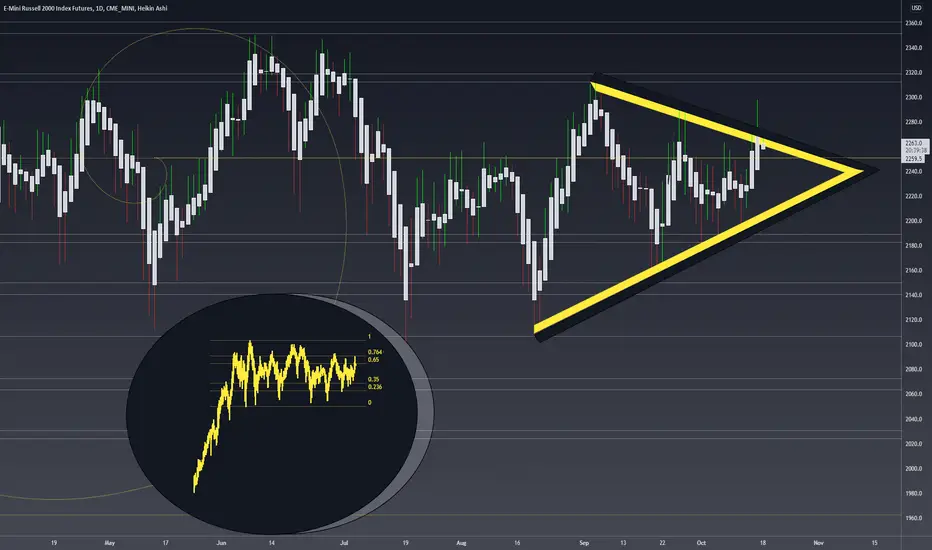
RTY1! - Wedge Back-TestThe Yearly Bull Flag continues as The Russell 2000 consolidated back to test the wedge pattern. Guided down today by the 2 hour 8 EMA, the Bollinger Bands have opened up and fallen away. Support was found at the Daily MBB.

RTY MFI oversoldRTY MFI oversold, not sure if RSI also needs to go oversold, but looks like a pump tomorrow

RTY UpdateThe only index that actually looks bearish, RSI dropping with MFI.
Could be a mixed open tomorrow. Tech depends on earnings

RTY UpdateSmall caps getting pumptarded. Target is around 2400 around next Wed, but there's a chance it could get rejected at 2350 resistance.
Note that it's close to overbought again, but market doesn't care during a melt up.
Not posting any other indices because all I'm gonna show is a melt up.

RTY1! - Back Into CompressionThis pattern is nearing an apex, with Opex in the rearview the rotation between NASDAQ the Russell on top watch; driven by yields and the 10 year note.
Futures Levels | Head Fake Or Higher? (ES, NQ, ZN, GC)It's nice when a projection comes together. Last week, our outlook suggested that we could see rates breakout, which would likely lead to broader stock index futures weakness. We got it half-right. Rates did breakout, but the rate rise ended up looking more like a head fake, so the selling was contained, with Friday even seeing a strong rebound.
This week there's not much to go on with earnings still a few weeks away. We'll be watching the BTC $50K level, 4400 ES, and if Gold can hold 1750.

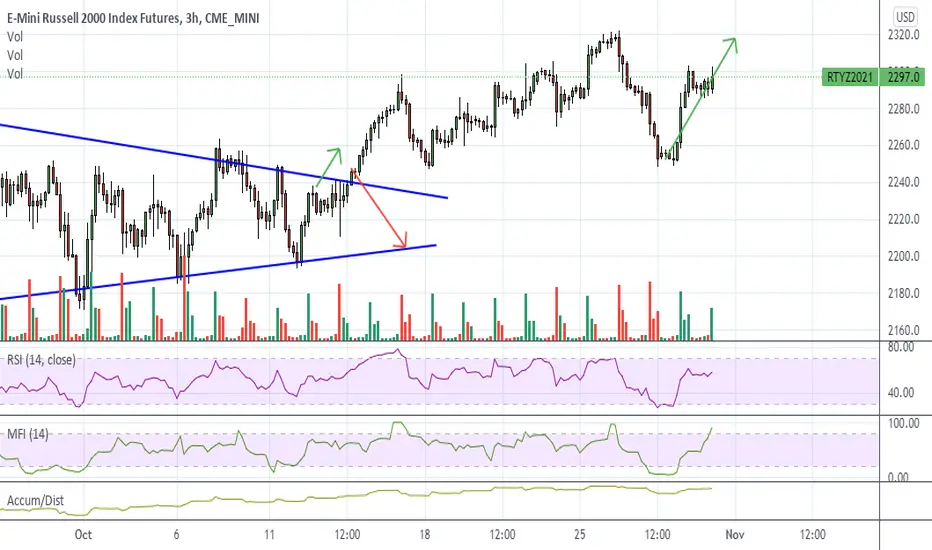
RTY whipsaw continuesStill doing the rangebound whipsaw, looks to me like it goes overbought by Tuesday and drops back down.
Small caps have a tendency to fill gaps (on the index, not futures) so maybe it fills the gap then cycles back down. If anyone has a good way to predict this whipsaw, I'd like to hear your theories.

Russell200010.1.21 RTY1! found a bottom, moving higher: Bobby's Homework Assignment. Review the entry strategy.

Market Dashboard - RecapWith NAS and SPX making Lower Lows it time to be on the look-out for RSI Divergences, Volume and a reversal pattern. The prospective i-H&S pattern on NAS was swamped by Russell confirmation of a H&S: as the Vix breaks out a pennant. The game changes Vix +20, in this case resistance is being met with instant selling pressure.

RTY UpdateLooks to me like a reversal coming tomorrow when RSI goes oversold. Didn't think it would rally without going oversold first, and I was right...
Needs to go down tomorrow, then we get a reversal.

ES MFI overboughtMFI way overbought, RSI is not there yet. Typically this leads to a pump and dump Friday, so probably a gap up tomorrow then dump, though the other scenario is Thu afternoon dump followed by an up Friday. We've all seen that before.
All other indices look similar.

RTY UpdateAll other index futures went oversold except RTY MFI as mentioned last night. It actually hit overbought again, lol.
If you're gonna play the bounce, I suggest staying away from small caps. I'm guessing gap up and tank tomorrow for small caps, it's too close to support not to test it.
ES updateWell, I had to take mom to teh airport so I missed all teh fun.
I said yesterday that today would be a pump and dump, only they left out the pump, lol. MFI almost oversold, RSI not there yet. Of course they can do the same thing they did this Monday....
No idea which way the market goes Monday, hoping it goes oversold and I'll buy some calls. Staying cash, there's no play here, too late to do anything.

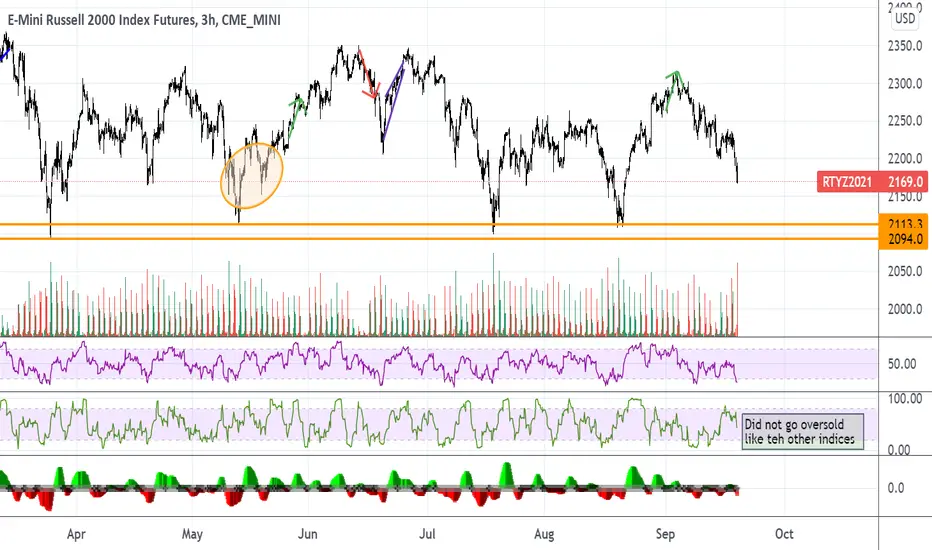
RTY Daily Range Looking For Long IdeaThe RTY daily time frame is in a large sideways
movement. The market hit resistance price point
2302.4 and is now falling towards support price
point 2113.3. It will be a good idea to look for a
bullish U-turn the closer the market gets to
the daily support price point 2113.3.
I plan on turning to the one hour time frame
and looking for a bullish trend to form near the
daily support.

