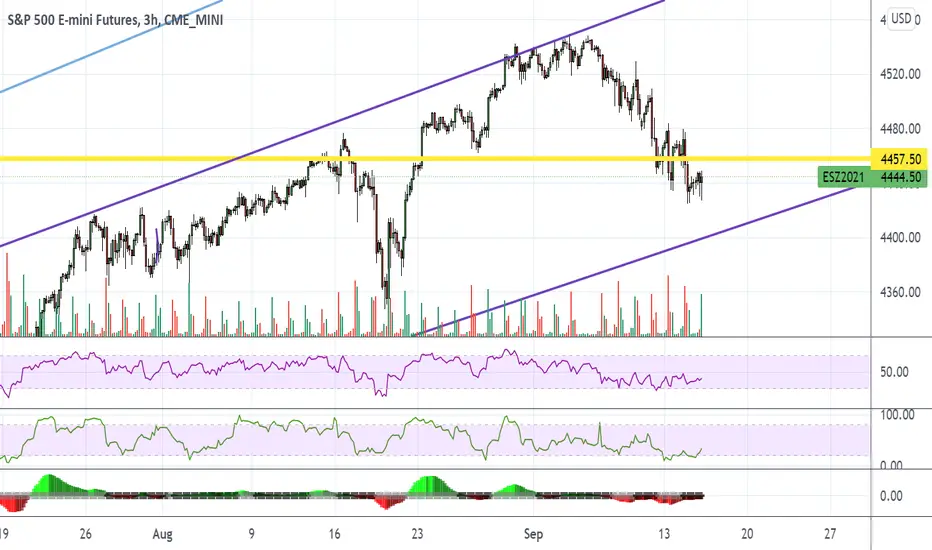
ES UpdateDoesn't show up well on the 3 hr chart because it reversed so sharply but MFI did hit overbought. I mentioned it on my RTY post yesterday and if you look at the RTY1! chart, it clearly goes overbought, so did YM. RSI having trouble holding above 50 like I mentioned earlier this week.
Tomorrow is Ponzi Friday plus quad witching. Expect the gap to close and big whipsaw regardless of which way the market gaps.
Indicators now neutral so hard to say which way this goes tomorrow. Will update only if I see anything. Not feeling very bullish or bearish today at this point.
Rty1

RTY MFI getting close to overboughtAppears small caps will be the first to hit overbought on MFI. Probably an up day tomorrow either way, but we'll see what happen on quadruple witching Friday.
ALl other indices are in the neutral zone

ES UpdateGap up and drop, gap up and drop, lol.
Still getting sold off every time RSI hits 50, let's see if it does it again tomorrow. I predict a gap up and drop, lol. (I think I'm kidding but I'm not sure)
Note: None of the indices are oversold anymore
ES UpdateAppears market did the pump and dump, big pop pre-market and no follow through.
Once again RSI stalled out at 50, looks to me like ES needs to hit my lower trendline before the next rally. Keep in mind that can happen overnight and reverse.

ES UpdateMFI hit oversold on all index futures, looks like a pump week.....
Unfortunately it happened overnight, looks like I take a hit on the small put position I carried over the weekend

RTY: One Hour time frame BullishThe RTY one hour time frame is in an up channel.
The market hit the bottom of the channel and
showing signs of pushing bullish towards the top
of the channel.
Entry: Counter trend line break bullish above
the bottom of the channel.
STOP: 2201.8
LIMIT: 2325.00
As long as the market stays above the bottom of
the channel. It will be a good idea to turn to the
five minute time frame and to look for tunnel
trader long / destination trader long opportunities.

Russell20009.12.21 Russell2000 Strategy......................................................................

ES Pre-Weekend UpdateRSI never made it over 50 and it looks to me like MFI needs to go oversold before we get a bounce.
More than likely hits my bottom trendline or comes close to it like last time. Not sure if the drop happens Mon or Tuesday.
i don;t like to carry a position over the weekend, but I am shorting a few foreign indices.

RTY OversoldES and NQ aren;t quite there yet so a little bit more room down, but I'd expect the market to turn around tomorrow to set up for Ponzi Friday.

ES Update 9/3Indicators neutral but NQ MFI went oversold and RTY MFI went overbought, so sector rotation.
Rotate, counter rotate, Imma getting dizzy, lol.
YM (Dow) also in the middle, no indication of direction
RTY oversold on MFIMFI oversold, small caps green already
Closed out my short positions from yesterday afternoon, not going long though. Might take a 2 day break instead.
NQ is still overbought though so typically a sector rotation when this happens

Tutorial | How To Use RSI To Find Turning Points ... or NOT!Hey Speculators - Happy Friday - welcome to another video tutorial, and thanks again to the @TradingView Editors for featuring my last post, which I've linked here, and is related to the topic on hand for today. That topic is how, and when, to not fight a trend.
I'd suspect many traders are familiar with the Relative Strength Indicator (RSI), used to measure overbought and oversold conditions. In this video, I discuss what I look for when using RSI to filter trade signals and identify when strong is REALLY strong. The inverse would hold true as well (you know, weak, or really WEAK), but we all know markets never go down. :)
RSI Settings for this video
5 Period
Upper 88
Lower 12

RTY +479 Ticks BullishThe RTY one hour time frame is in a large side
ways movement. The market hit the bottom of
the sideways range and broke the short term
down trend line. The market is now in the buy
zone at a high price.
Entry: Counter trend line break bullish in the
buy zone.
STOP: 2085.1
LIMIT: 2325.00
As long as the market stays above the bottom of
the range. It will be a good idea to turn to the
five minute time frame and to look for tunnel
trader long / destination trader long opportunities.

𝗦𝗺𝗮𝗹𝗹-𝗰𝗮𝗽 𝗨𝗽𝗱𝗮𝘁𝗲: $IWM Daily. Macro UpdateMacro picture its a bullish setup unless proven otherwise on a ~210 support (200dma) break. > 235 confirms breakout
$RTY_F $AMC $CROX $SPY $ES_F $QQQ $NQ_F $VIX $TLT $TNX $DXY #Stocks #Trading

RTY One hour breaking into buy zone.The RTY one hour time frame is in a large side
ways movement. The market hit the bottom of
the sideways range and broke the short term
down trend line. The market is now in the buy
zone at a high price.
Entry: Counter trend line break bullish in the
buy zone.
STOP: 2085.1
LIMIT: 2325.00
As long as the market stays above the bottom of
the range. It will be a good idea to turn to the
five minute time frame and to look for tunnel
trader long / destination trader long opportunities.

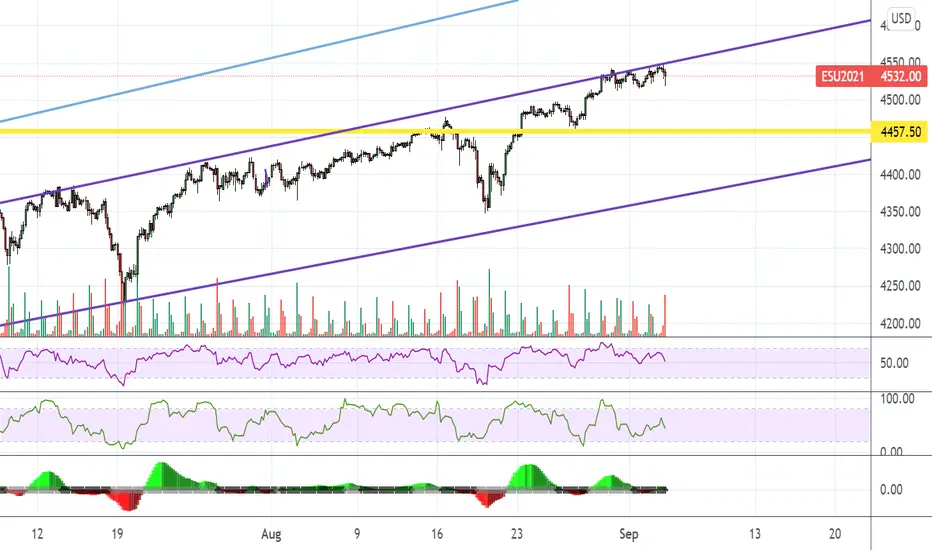
Futures Levels | Look Ahead For The Week of Aug 22The VIX popped and dropped last week making the selling again a very short term event. The S&P ES1! is right back on trend after holding the 55EMA on the daily. Gold GC1! is in balance and crude CL1! continues to look like it wants lower prints.
Economic Calendar Week Starting Sun, Aug 22
Monday, August 23
EU Manufacturing & Services PMI 2:15 AM CST
US Manufacturing & Services PMI 8:45 AM CST
Thursday, August 26
Jackson Hole Economic Symposium All Day
US Preliminary GDP 7:30 AM CST
Friday, August 27
US Core PCE Price Index 7:30 AM CST

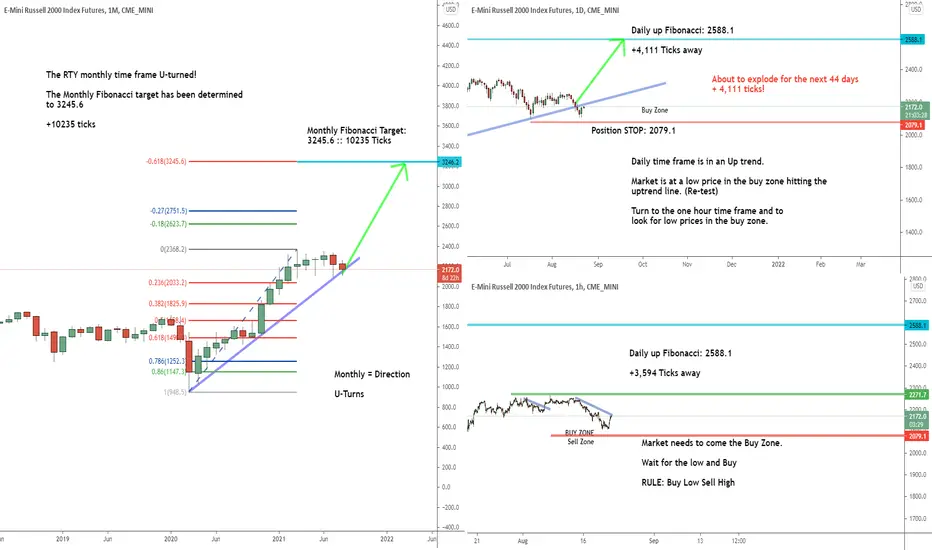
Major U-turn on Russel 2000RTY is U-turning on Monthly.
Daily is on the lowest (if the trend continues).
1H broke the Down Gartly.
RTY Daily +2,000 Tick potential moveThe RTY daily time frame has created a consolidation range. The market is at the bottom of the range showing signs of pushing bullish towards the top of the range. If support can hold and the market pushes towards the top of the range. The research shows a +2,000 Tick bullish push opportunity.

RTY UpdateMFI heading towards overbought quickly, if there's one index I'm bearish on it's small caps.
I think there's a possibility of another leg down next week.

RTY1!8.19.21 Russel Mini: Long trade. Three things that added miserly to my trading: when I had 8 monitors; having great patterns. but not using the alert tool to "watch" the market for me; drawing too much ( I was working hard but I was distracted away from the great entries on another market).

+600 Tick Idea on RTY One HourRTY one hour time frame is in an up channel. The market is at the bottom of the channel. If the market can give a counter trend line break bullish while staying above the bottom of the channel. The research shows there is a strong history the market could increase +600 ticks towards the top of the channel.

RTY UpdateIndicators in the middle, no idea which way this goes
Something to keep in mind.... last August, every index rallied except small caps. It just went sideways, same can happen here.

RTY - Testing Channel BoundaryRotation on watch as the CPI will set direction for the remainder of this week's trading.
