Rty1
ES MFI OversoldMFI oversold on RTY, NQ, and ES.
Flipped my puts, done for the day. Didn;t make much except for EWZ. Decent return there.

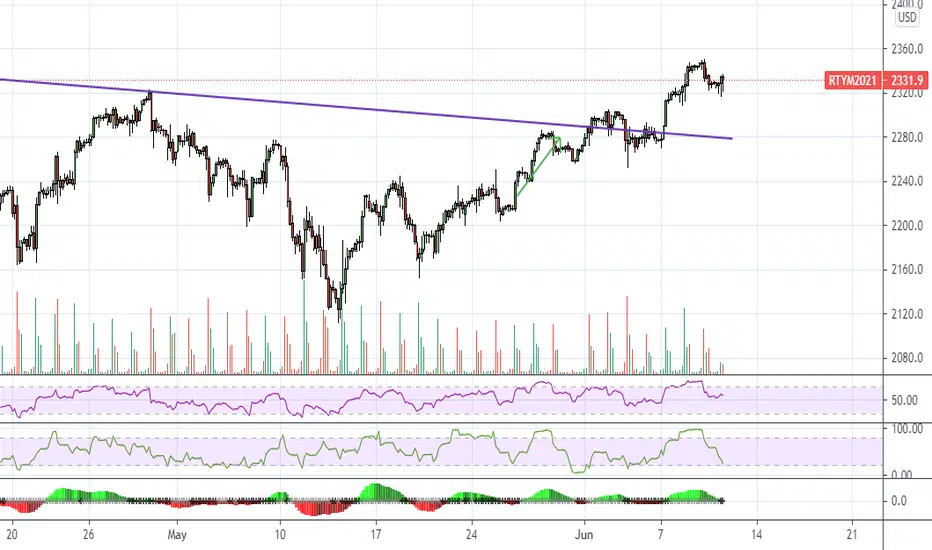
RTY Trend Change + Backtest: Bullish AugustRTY has successfully executed a linear regression crossover on the daily period (where the 14 period linear regression line crosses the 30 and confirms by also crossing the center ribbon 0.2, 14 STDV BB).
RTY has also backtested the crossover without breaking through it (yet). We have an excellent entry here as well as a clear place to exit the trade if the bullish structure breaks down.
Targets are the upper band at 2357 and above.

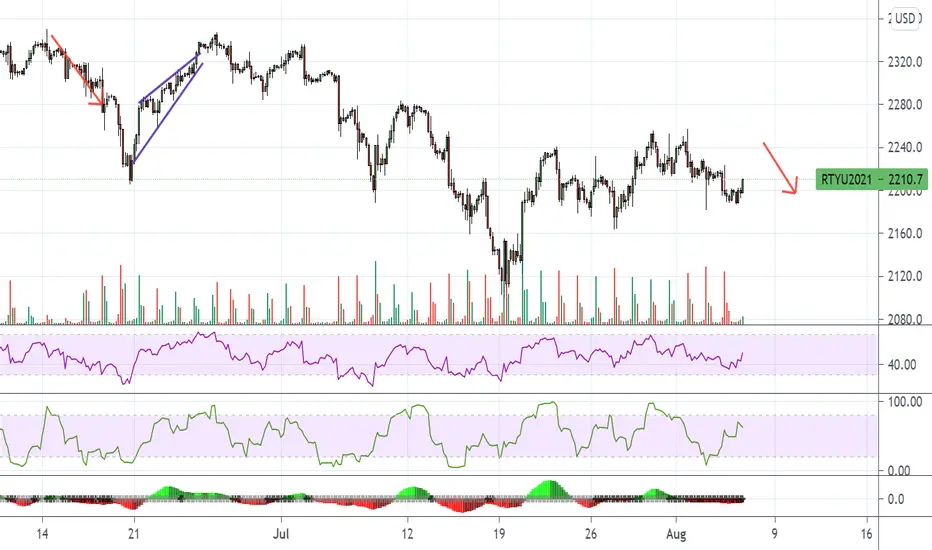
RTY - Early Morning Moves into Mid Morning FadesThis Pattern has been the name of the game for the last week as the inverse H&S pattern did not break with the volume needed for a sustained move. The juxtaposition between NAS and RTY looks to continue. Jobs numbers on Friday should give direction.

RTY - .786 RESnew line in the sand. The market is digesting the GDP miss and the post tech earnings hang-over with AMZN being a bit light. A back test and hold of the inverse neckline will be on watch for rotation. OR will a correction in price ensue opening up some ranges?

Market overview mid-week update - Week 30At the moment the big question is whether the market is taking a breather, and will continue to go up? Or is it topping out and will we have a correction to the downside soon?
I can find a arguments for both, so I think we need to just sit on our hands and wait till the market unveil their intensions.
S&P 500 (ES mini future):
Sofar the market action is panning out as expected (see See Market Outlook - week 30). not much action and forming a reversal candle.
At the moment the weekly low is 4364.75 and if we are not going below that this week and also not very far above the current weekly high of 4416.75 one could consider going short next week on a break below 4364.
Also the daily chart is not giving much information it's a sideways movement where intra-day losses, are retraced for the most part.
Nasdaq 100 (ES mini future):
Actually it's the same picture as the S&P mini futures on the weekly and if we close the week at around these levels, then next week a short may be possible when trading below current weeks low.
Looking at the daily chart, it offers a little bit more clarity than the S&P daily chart, because on Monday an attempt was made to break the 20 day MA and was nicely rejected on a rebound on Tuesday. This might even suggest that the 1-4 candle correction (b/c MRI sell) on the weekly is already dealt with.
But as long as we have not crossed the break-out line I'm not willing to call that yet.
Dow Jones Industrial (ES mini future):
It's getting boring but there is also not much difference here from Nasdaq and S&P. But since there was a starred candle last week, one could consider a long at this point, but looking at all the other indices discussed here I myself am not willing to that.
Also the daily is not able to shed light on the situation and is moving sideways.
Russell 2000 (ES mini):
The Russell was a bit of a trouble child at the start of the week, but it is still holding the trendline drawn from last year's March lows. But as long as we are below the 20 weeks MA I don't really see a long opportunity here.
And as with all the other indices nothing to tell really about the daily chart as well.
As always, this is not trading advice, but only my views on the market.
Please do your own research before entering any trade.
Happy trading

RTY Daily Bullish PushThe RTY daily time frame is in an up trend. The
market is making higher highs and higher lows.
The market hit the up trend line and is pushing
bullish towards the up Fibonacci price point 2588.1
about +3,754 ticks away. I plan on turning to the
one hour time frame and looking for low prices
in the buy zone.
****It is always a good idea to trade with good risk management.****
Remember, success over time, not one time.

Futures Levels | Look Ahead For The Week of Jul 25There is a lot on tap this week including earnings from most of big tech (TSLA, AAPL, GOOG, MSFT, AMZN, FB) and a Fed Meeting/Policy Statement Wednesday. The S&P (ES), Nasdaq 100 (NQ) and Dow (YM) all hit all time closing highs on Friday so it's a break out or bust look on several charts.
Let's take a look at the levels for the stock index futures, bonds, gold, and Bitcoin for the week of Jul 25, 2021

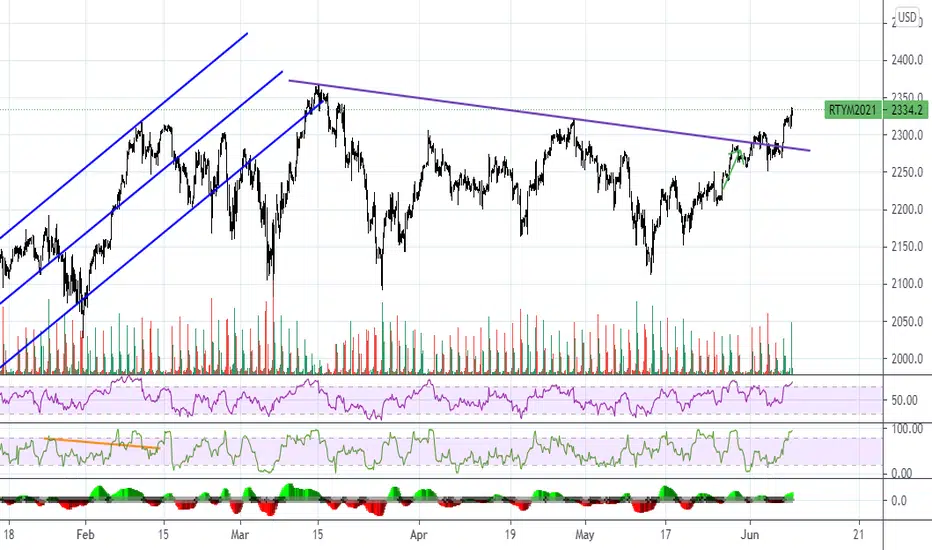
SMALL CAPS CORRECTION OR HUGE BREAKOUT?The perfect storm event known as the Covid pandemic has introduced many millions of new traders into the circus. The indices have performed amazingly well over the last year.. nearly parabolically so. While I do not believe the indices have formed a major top yet, a minor pivot is likely. I have been hoping for a decent correction to shake things up. I am not certain if we'll even get that. I'm looking at this pattern on the Russell 2000 (RUT, IWM, RTY1!) that is either an ascending wedge or a bull flag. Watch price action closely in this range. If it breaks below, it will likely do it very quickly and flush a lot of these new traders out. On the flip, if it breaks above... well, prepare for another move that defies gravity.
What do you think will happen? I'd prefer a flash crash type of event. Personally, I believe having an equal long/short (hedge) is not unwise aka strangle.. Let's see what happens!

+4,707 Tick Bullish Push RTYThe RTY daily time frame is in an up trend. The
market is making higher highs and higher lows. The
market is at a low price in the buy zone hitting the
uptrend line. The market has an up Fibonacci with
an extension above the live market price point
2588.1 about +4,707 Ticks away. It will be a good
idea to turn to the one hour time frame and to
look for low prices in the buy zone.


Futures Levels | Look Ahead For The Week of Jul 18Stock indices finally broke their uptrends last week, and the small caps (RTYU2021) completely fell apart. In the first of what may become a Sunday evening series, I take a look at what the Volume Profile and price structure may be telling us in terms of levels to watch this week for the ESU2021, NQU2021, RTYU2021, GCQ2021, ZNU2021, ZBU2021, and MBTN2021.
Quick take away is my favorite idea is to fade the strength in notes and bonds looking for rates to bottom in this cycle.

RTY MFI OversoldNot feeling bullish, but MFI is oversold. Lot sof speculative stocks have been down, so expecting a pop sooner or later

RTY Daily Bullish Push +1,000 TicksThe RTY daily time frame is in an up channel. The
market is moving from the top of the channel
towards the bottom of the channel. The market
created a down Fibonacci with an extension price
point 2180.3 which matches with the bottom of
the channel. It will be a good idea to wait for the
market to fall towards the bottom of the channel.
Then turn to the one hour and look for low prices
in the buy zone back towards the top of the
channel price point 2363.7

RTY hit oversold overnightRTY went oversold, NQ went overbought so probably a counter rotation, lol.

RTY Daily Bullish ChannelThe RTY daily time frame is in an up channel.
The market is at a high price hitting the top
of the channel. According to the research, it will
be a good idea to stay out of the market and to
wait for the market to give a low price near a
known level of U-turn either at the bottom of
the channel or above the the channel. There is
an up Fibonacci extension above the live market
price point 2588.1 about +2,531 ticks away. As
of now, I am out of the market wishing to be
in.

RTY, +1,000 Tick Bullish PushThe RTY Daily time frame is in an up channel. The
market is moving from the top of the channel
towards the bottom of the channel. As long as
the market stays above the bottom of the Channel.
I am expecting the market to U-turn bullish towards
the top of the channel price point 2356.3 about
+1,126 Ticks away.
It will be a good idea to turn to the one hour
time frame and to look for the market to
enter into the buy zone.

RTY OverboughtES and YM oversold, RTY overbought. Meme stock short squeeze appears to be over and normally this would mean a rotation into safe stock.... but the market has been anything but normal lately, lol. Even right now ES and YM look weaker than RTY like they want to throw an exhaustion gap tomorrow.
No compelling shorty trades, looks like a melt up. The only thing I would consider shorting today is China.
RTY One hour, +200 Tick bullish pushRTY is about +200 ticks away from the daily limit. As long as the market stays in the buy zone market should push to the projected limit price. Once the daily Fibonacci extension price it hit. It will be a good idea to stop buying the RTY to see if the daily resistance level will push the market back down to the daily support.

RTY Daily +400 Ticks Bullish PushThe RTY daily time frame is in an up channel. The
market hit the bottom of the channel and showing
signs of pushing bullish towards the top of the
channel price point 2327.0 which is also an up
sub Fibonacci extension about +411 Ticks above
the live market. It will be a good idea to turn to
the one hour time frame and to look for low prices
in the buy zone.

RTY1! (Russel) : 2 areas of potential bullish reactionPrice could dip into discount, mitigate some 4H zones and then go higher.
Wait for confirmations before going long. GLGT.

RTY, +1,000 Tick bullish pushRTY daily time frame is in an up channel. The market hit the bottom of the channel and is showing signs of pushing toward the top of the channel. The market is starting to make an up Fibonacci with an extension about a +1,000 ticks above the market price. Turning to the one hour time frame and looking for low prices in the buy zone will be a good idea as long as the market stays above the bottom of the daily up channel.
