Rty1

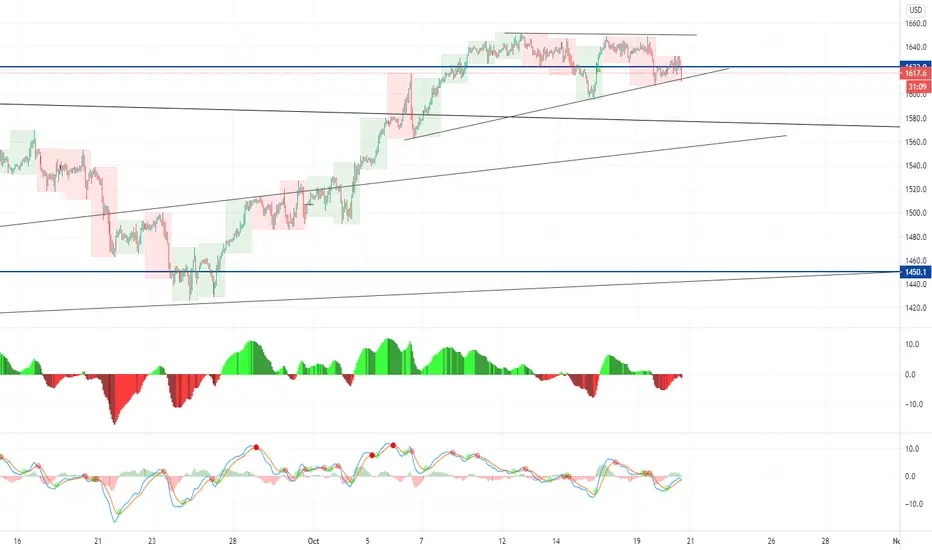
STRANGLE FOR PROFITThis year has been one of the best to be a (smart) trader. We've had absolutely historic opportunities and I'm sure there's more to come. This little ascending wedge (abcde) could be creating an opportunity for a strangle (long & short). I have several strategies I follow for the other indices but I will occasionally play a strangle where I can see it going either direction. Personally, I may wait until (E) is tagged and will buy a long position in calls and hedge that position with puts. There are other ways to play the breakout but I prefer to buy at (E) and wait until a target is reached (up or down). I also like to use options that have a medium term expiry (5-6 months out) so decay and noise aren't too dramatic. Let's see what happens!

RUSSEL (4H) Backtest : 68% win rate across 19 trades => 17.8 RDetailed backtest result : prnt.sc
Non-looser = 84%
Icons on the chart
Thumbs up : Trade was a win
Thumbs down : Trade was a loss
Circle with a cross : Trade was breakeven
Cross : Did not take the trade due to presence of liquidity (equal highs/lows) behind the stop loss
Variables
Avg winner = 1.6R
Strategy : wait for market structure break, then trade the retest of that zone. Zone is drawn using the first candle which crossed the pivot high/low to begin trapping the traders.

RTY dor long $$$Hi traders and investors , if the price breaks the parallel channel and the resistance with the volume we will see a great rise and if the price breaks the parallel channel down of couse the market will go down

RTY (Russell) (4H) : Liquidity run coming!Who wants to bet that RTY (Russel) is setting up for a liquidity run on those juicy equal highs?
If that's the case, this could be short term bullish but then bearish.


Bullish Russell (RUT)MACD indicator breaking out before price.
The PMO also trending up successively.
Interesting Small Caps Strength... IWM
Market history of cycles suggests small caps perform best in the early innings of a new bull market.

PLUG and other parabolic stocks - IWM overlayNot sure why it didn't dawn on me earlier, all of the stocks mentioned in my previous post like:
BYND, PTON, BLDP, FSLY, ROKU, JKS, etc
They're all being pumped up by small cap index.... that's how they're going to get RTY1! (small cap futures) to close the COVID gap. I was trying to figure out where all this money is coming from....
So if you're betting on these stocks, long or short, pay attention to RTY. The overlay is IWM (small cap index fund)
BTW, RTY is overbought, but keeps going up anyways.

Russell's Temporary Breakout 10/4/2020RTY at the daily view.
The RTY finally broke out of its short-term resistance (blue line). However, it's still in a giant sideways to slight downward channel. Furthermore, RTY has been in a general box between 1400 to 1600 for years. The reason for its sub-1400 days was due to unusual bear market events. The reason why it was above the 1600s before is because TSLA was once part of the Russell 1000 - now part of the NASDAQ.
Russell is actually one of my favorite indices to trade because of its predictability. Now, we are see tech going down and small caps going up. That kind of reeks of institutional movements - much like what happened in July.
Not much to say. Russell is literally one of the few indices or sectors that I short when it reaches around 1600 - might be a little lower this time. I plan to long when it reaches the mid-1400s. It's been in predictable trading box which is why I really like it.

Monitoring the RTY Monthly time frame for the next big push. RTY should soon approach the monthly resistance. If resistance holds. Market could fall... If it breaks through, could be a big bull push. Will keep my eye on it.

RTY - Possible Downward Channel Forming 9/12/2020RTY at the daily view.
It seems that the RTY is stuck between an upward channel and a downward channel. Since liquidity levels are dropping pretty fast, that downward channel is starting to become more legitimate.
If so, there is a gap at 1419 that has yet to be filled. Algorithms and the selloff can head over there pretty fast. Since liquidity is back going downwards, it seems RTY is going to back as my favorite short target again.
Unlike the NQ, RTY is a little more predictable in its bigger levels. That's what I like about this index.
RVX (RTY's VIX) 9/6/2020RVX at the daily view.
This is a project that my trading team and I are conducting. This is 4 of 9 charts (available on Trading View) that searches for clues for an imminent correction by using both June and September 2020 cases. It's a comprehensive overview that connects the charts volatility, trends, divergences, credit, and currency strength.
In this chart, the RVX had RSI divergences prior to the corrections. In addition, the RVX created 3-4 higher lows in a row prior to a correction.

+1,700 Tick push on RTY. Read Description Carefully!The RTY daily time frame is now hitting the inner up trend line. If support holds I am expecting the market to push bullish and break above the 2019 resistance level. I plan on looking for counter trend line breaks bullish in the buy zone starting Monday.

My guy RTY BACK AT IT AGAIN. GOOD OL' RUSS!LONG @ 1570.0 (4HR)
SL @ 1558.0
TP @ 1605.5
HELD ABOVE SESSION POC (GRAY LINE)
LOOKING FOR RETEST OF POC (RED LINE)@ 1580.20
IF IT REJECTS THEN PRICE WILL LIKELY PULL
BACK TO SESSION POC (GRAY LINE)
OR BELOW TOWARDS VWAP (PURPLE LINE).
IF IT DOES NOT HOLD VWAP I WILL BE LOOKING TO GO SHORT.
LETS SEE HOW THIS TURNS OUT

RTY pivotal point! RTY1!
RTY futures are at a pivotal point in price, looking at breakout territory. Since most of the indexes have made their new ATH. I am expecting the same in RTY, the caveat to this is that the stocks within the index need to recover, and since these stocks are small caps, it may be a little while before they recover due to economic impacts suffered by COVID. But this setup looks great on technicals, we can either chase long on the breakout or flip short if trend is broken.

RVX (RTY's VIX) at a Decision Point 8/23/2020This is the RVX at the daily view.
The RVX has finally reached a decision point between the long-term wedge resistance and the supports below. Currently, the RTY is in a giant bull flag since August 3rd and doing a "correction over time."
A correction over time is actually a bearish in the very short-term, but bullish in the medium-term. Currently, the RTY is coiling up for another move up. The RVX indicates that more sideways to down movement is ahead for the RTY until the bull flag finally plays out. The RTY's bull flag is canceled out around 1460.
Currently, the bears flocked to both the NQ and the RTY. The market tends to hunt for shorts first and the the longs. Judging by how many bears have saturated the RTY, I'm expecting a small spike down first and then a rather big short covering rally.
Greed tends to punish both sides.

RTY's Bull Flag Pt 2 8/18/2020RTY at the daily view.
The Russell is still bull flagging. It's quite obvious by now. The downward movement is sometimes called "correction by time."
A correction by time is not actually bearish. It means the Russell is consolidating for another move up. Unless the bears take the RTY down to the bottom of that flag pole, it's still bullish. The bears had a chance all this time to take it down. They didn't... yet.
Liquidity levels are high enough to go scuba diving in. The chances of bears taking this below the flag pole? You might as well take a shot at the lottery.
The most likely course of action is that a further pullback will just gather more buyers below - like me. If not, then the bull flag may bring the Russell even higher.

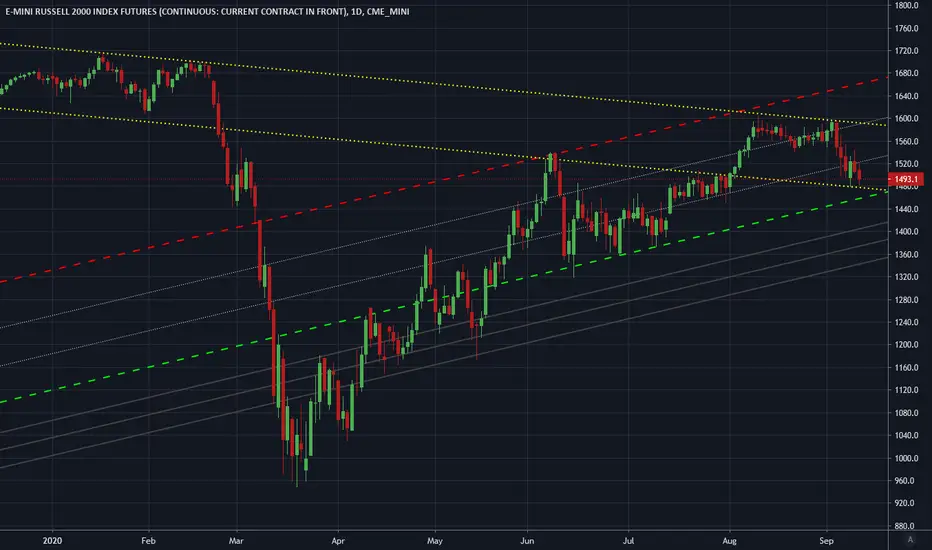
Elliott Wave View: Support Area for Russell 2000 (RTY)Elliott Wave View of Russell 2000 (RTY) suggests the rally from July 31,2020 low has ended at 1605.70 high as wave 3. Up from July 30 low, wave ((i)) ended at 1482.60 high and wave ((ii)) dips ended at 1467.80 low. Index then extended higher in wave ((iii)) towards 1552.60 high. The internal subdivision of wave ((iii)) unfolded as 5 waves impulse Elliott Wave Structure. Wave (i) of ((iii)) ended at 1510.60 high and wave (ii) pullback ended at 1493.70 low. Rally higher in wave (iii) then ended at 1551.60 high, followed by wave (iv) pullback, which ended at 1543.40 low. Wave (v) then extended higher and ended at 1552.60 high.
Afterwards, the Index did a pullback in wave ((iv)), which ended at 1534.20 low. Finally, wave ((v)) higher ended at 1605.70 high. This final move completed wave 3 in higher degree and ended cycle from July 31 low. Index is currently correcting that cycle within wave 4. The correction is unfolding as a double three correction, where wave ((w)) has ended at 1560.90 low. The bounce in wave ((x)) ended at 1589.60 high. Wave ((y)) remains in progress right now. As long as 1451.10 low stays intact, expect the dips in 3,7 or 11 swings to find support for more upside. The 100-161.8% extension of wave ((w))-((x)) where ((y)) can end is at 1516.76-1544.71 area and is shown with a blue box. That area if reached later can produce 3 waves bounce at least.

Boring Price action today on M2K.On a low volume day like this VWAP and open range breakouts is what i i'd be looking for to execute a trade safely. Sitting on hands is always the safest too.

Good old M2K!Failed to break and hold POC @1580.40 testing vwap @ 1578.90 if it can't hold VWAP then it will likely retest previous POC @ 1576.5 and if that doesn't hold then the daily open @ 1575.1 will be the next test on on its way to daily low @ 1572.9. lets wee what happens

Russel's Bull Flag 8/15/2020RTY at the daily. The title speaks for itself.
The Russel is bull flagging at this point. Although, another pullback is projected around August 17-19. In the bigger picture, that pullback is merely a consolidation for the RTY. Liquidity is still very high.
What would be the unexpected move? A pullback to lure the bears. A bounce and break a new high to lure the bulls. Then finally a correction.
Institutions' distribution of the NQ should be ending near the end of the summer... which is soon. The Russel made some awesome gains of over 200 points in the last month. However, the phase of uncertainty among all major indices should begin soon.

what a nice short M2k! quick scalpRejected off of 1560.9 after major sell off and broke above POC 2 1562.9 looking to long.
ENTRY: 1562.6
Exit: 1566.0
Stop: 1562.6
