Rty1

RTY UpdateMoney still flowing into small caps, and a bunch of garbage stocks look squeezy again like PTON for example.
Even if you're bearish, I don'rt recommend shorting anything with high short interest
No positions since I'm taking a break tomorrow.

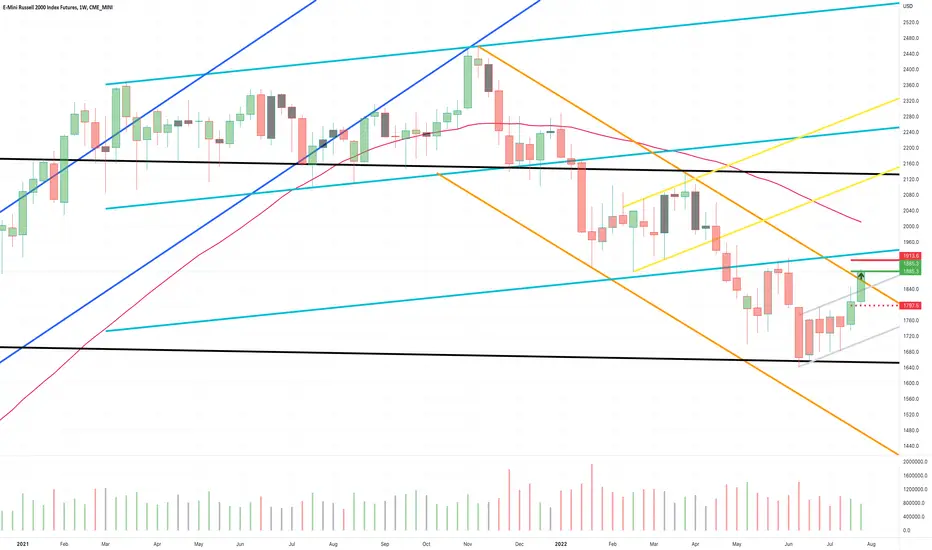
RTY Daily in up channelThe RTY daily time frame is in an up channel. The
market is near the bottom of the channel. If
support holds. It is expected the market to push
bullish towards the top of the channel price point
2076.3 about +2,840 ticks above the market. It
will be a good idea to turn to the one hour time
frame and to look for low prices in the buy zone.

RTY1! - Weekly Market Update, 8/29Russell 2000 approaching support @ 1889
Followed by its 50 day SMA, below which several structures could catch price as well.
Should price fall past our prior lows set, the next leg down of a bear market will be what we're looking at

RTY UpdateRTY MFI is already overbought.
I don't recommend shorting anything but be cautious on small caps. NQ is heading to overbought rather quickly too. We could see some whipsaw to end the week.
Bullish on China though, only because HSI is oversold.

RTY Almost oversoldI still don't think that was the top, looks to me like we get another pump when RTY MFI gets oversold.
Was busy timing my AMC play, lol. Dumped on the gap fill overshoot and just re-entered, figured it wasn't gonna go down more than a buck. Might wind up being a day trade, planning on bailing if teh market doesn;t kick up after the Euro markets close.
Seems to me like small caps went a little overboard on sell, but the Euros finally dumped so there could be another gap down tomorrow.

RTY UpdateThe melt up and short squeeze continues. I have it continuing until next Tuesday when RTY hits the resistance zone.
I don't normally play melt ups but bought some AMC calls for kicks and giggles on the dips this morning. If the market is acting stupid, then you need to be stupid too, lol. The only way to make money is to go with the flow.
Prediction is up tomorrow, a dip Thu and Friday open, then full pumptardedness until Tuesday.

RTY not much to add since my last updateWe are at the first maj resistance - 110MA Weekly magnet.
RTY hit 200MA on daily, while others are lagging behind.
- 2032-85 is where I think this move will be capped, if we actually extend above 110MA.
It can still extend up to 2084-2108
I expect tomorrow red close

RTY1!8.14.22 Yesterday I gave you my overview of the Russell and the es mini from a longer timeframe perspective. I went back and took a shorter timeframe perspective on the Russell, and compare it to the longer time frame thinking. I tried to discuss the advantages and disadvantages. I tried to describe a psychological aspect from my point of view, and I'm very much aware in my own trade decisions what the triggers are for my stress. Most of the time I would say that you should look at the Behavior of the market in an "objective "way...based on your observations of market behavior...which can definitely be done, but not all the time. The example I pointed to in this video found the reversal point, but the market came back close to it without making a new low 4 weeks, and from my point of view that's going to be a tough trade for me... and explain why. It doesn't matter if the market never goes below my entry, It doesn't really appeal to me to stay long in a market that doesn't move any significant range off the bottom and for three or four weeks it keeps on coming down to my entry. That is not my concept of Joyful Trading index futures. That's a function of me, not the market. Take a look at it and see what you think as it pertains to you.

RTY is overextending on the upside and downsideI haven't look at RTY for a while now, till the Fri close where I shorted it at 2015.50, willing to add if we stretch into the maj resistance zone right where the upper Bollinger is, that is also a 2.618 extension off the lows
RTY is overextending on the upside and downside compare to SPX .
We hit 50% retracement off 2020 lows in June and I see the whole way as 5 down and 3 up here.
We hit 110MA on Weekly as well as 200MA on Daily. If it's acting as it was on the way lower, SPX might not even reach 200MA in this case.
We are at the very top for this bear market rally, it can still extend up to 2084-2108
We are also at/near 61.8 off Mar high and Jun low as well as near 50% off the ATH and Jun low retraement
I will update the target for the Oct low after I see confirmations of the top.

For all the urban (RTY) traders in this market in the coming dayFor all the urban (RTY) traders in this market in the coming days, due to the formed reversal candle, equal to the number of buyers in the last 1h, which is shown in the drawn circles

Rty1! ES8.13.22 The Russell and the ES have foolish Swings, but the bigger pattern suggests that these markets will move lower and possibly make new lows. The bigger picture is that we are probably in a significant bear market....And I would be waiting for my trigger too short....As well as taking profits on the swing higher.

Russell2000 Targeting A 2000 TestIn this update we review the recent price action in the Russell2000 futures contract and identify the next high probability trading opportunity and price objectives to target

Will RTY Daily Resistance Hold?The RTY daily time frame is in a down trend. The
market is hitting the down trend line. At the same
time the market is hitting an up Fibonacci
extension price point 1890.50. Usually when this
happens. The market has a bearish reaction. If the
market continues to push bullish and breaks the
down trend line. It will be a strong sign the buyers
are taking control. If the market cannot break and
close above the down trend line. It is expected
the sellers are taking control and will push the
market back down.
As long as the market stays below the daily
down trend line. It will be a good idea to turn
to the one hour time frame and to look for
high prices in the sell zone.

RTY1! - Weekly Market Update, 8/1/22Russell 2000 Futures post a countertrend BUY signal ... Ideal entry, stop and target imaged on the chart.
Support and Resistance structures have been adjusted accordingly for your reference.
Wishing you a blessed and profitable week ahead.
RTY UpdateOverbought again after the morning dip, looks like a melt up and 4 day short squeeze so not shorting anything at the moment aside from the put leg of my BITO strangle. Calls are now in the money so hopefully crypto goes pumptarded on Ponzi payday Friday.
I'm 75% sure this is a melt up, but if you're long I suggest some protection.
RTY Daily down channelThe RTY daily time frame is in a down channel.
The market is at the top of the channel. If
resistance holds. The research says to expect the
market to push bearish towards the bottom of
the channel price point 1554.6 about -2,620
ticks below the market.
It will be a good idea to wait for the market to
close below the short term up trend line before
turning to the one hour time frame to look for
selling ideas towards the bottom of support.

RTY UpdateRTY hit my first target, overbought on RSI and MFI along with NQ and ES
Funny thing is, I totally called market direction wrong on open, but made money by picking the right stock. That's the opposite of what usually happens to me when I call the market direction right but pick the wrong stock, lol. PDD is still red and looks like crap.
Not expecting a tank but I do expect at least a dip tomorrow because everything is overbought, TSLA earnings tonight, ECB tomorrow morning, and Thu is usually the weakest day during a bull run.
Chinese ADRs look pretty weak, will go down further with the market if it reverses here.
And oh, BTW, the gap filled as promised, lol. Keep an eye on futures gaps. Only works for US indices though.

Russell To Rollover From 1830'sIn this update we review the recent price action in the Russell2000 futures contract and identify the next high probability trading opportunity and price objectives to target

Stocks Chew Through Resistance and moreS&P, NQ, and equity indices chewed through resistance today. U.S. Dollar weakness is underpinning strength across risk assets. Crude is at an inflection point. Let's dive in.

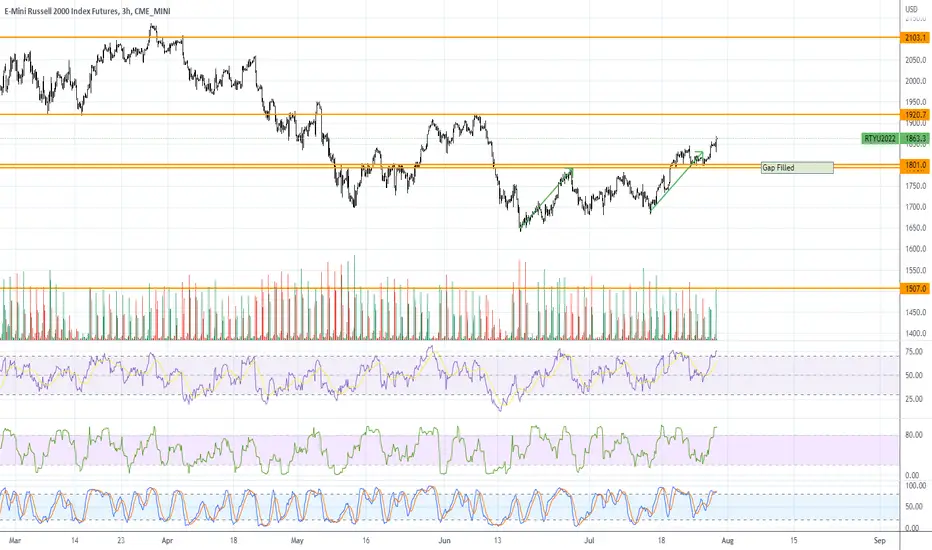
RTY UpdateRSI overbought but it's obviously going for the gap fill
I guess I should've stayed bullish, lol. Wasn;t really sure yesterday.
I was expecting a gap down then up move yesterday and the market did the exact opposite so left me a bit confused, lol.
Missed this Ponzi Tuesday rally, not gonna chase it at this point. Gonna stay cash and wait until NFLX and TSLA earnings tonight, hopefully they tank the market so we can buy the dip. Bullish until RTY gap fill.

SPY and ESIndexes are still sideways on weekly timeframe between 3640 - 3950. Its been 5 weeks for now and i think we may have another week of this chop. Market will mostly break this range after the fed meeting on JUL 27th. If we look at candle stick chart on weekly time frame, we can see that we had alternate red and green weeks and mostly closed below the 50% of the range for the week if its a red week and above 50% of range if its a green week. This week broke that pattern, we had a red week but closed almost at the highs of the range. POC and also is at the highs of the week which is good.
Coming to the Daily profile, Friday's profile is pretty peculiar with single prints above and below the close price. You can see that we have single prints from 3884 - 3900 on the upside and 3820 - 3811 on the downside which were created Friday on the back of strong retail report. Pretty rare that we see single prints both above and below so close to the closing price of the week. Coming to Friday’s profile, its a “P” shaped profile which generally indicates emotional short term trading especially when it occurs in a choppy range based market.
UUP weekly candle looks like a topping candle but i would have been more confident if we got it on DXY too. DXY weekly has back to back top wicks after an extended rally. So, there could definitely be merit for UUP topping candle. As i have been saying for several weeks now, this USD strength is not good for global economies. Leave Asia or Africa, take Europe as an example, EU is a net importer of primary goods. They import most of food, beverages and oil whose prices have been soaring and due to USD strength, their Euro is down in the gutter already. USD/EUR is at parity last week. If this dollar strength persists, EU will have a lot of pressure on its forex reserves and combined with their central bank lagging miles behind the curve on inflation and rate hikes, its a recipe for disaster. US equities cannot stage a consistent rally unless USD comes under control imo.
OIL is another market which needs to hold around this 90-100 range imo. Apart from severe demand destruction, i don't see any other reason why oil should come down drastically especially with Biden’s Saudi trip not yielding much results. If demand destruction occurs, it should only come with recession whether mild recession or strong recession is another debate altogether but we should have something which is again not good for markets.
CPI came in pretty hot last week and everyone was calling for a crash on markets with some people calling 3400, 3500 on ES but i had a different view. I said it will be really difficult for markets to break 3700 and ES held that level like a champ and rallied almost 150points. The main reason for this is oil prices being down a lot from last month and that should help reduce next months CPI reading. Although oil prices are just down to may levels where we had high CPI number too, it is only one piece of the puzzle. Take a look at commodity prices, they are off 21% from highs and still down 10% from may readings too. Shipping prices well off their highs too and these two things combined with oil prices should give us a lower CPI reading imo. Market is always forward looking and i thought if CPI reading was going to come in lower for JUL month, there is no need for markets to panic on last reading. Thats why i was inclined towards that down move being a trap for bears.
Being said that about CPI, now FED needs to calm down and not do 100bps hike on JUL 27th meeting. If indeed CPI is going to come down next month, there is no need for them to be too aggressive with 100bps hike and choke off money supply to the markets. I personally would like 50bps hike in JUL, AUG and SEP rather than than do 75bps now and 25bps in SEP just to give economy a little breathing room to regain its growth but more than likely they might go 75bps in JUL. In any way market is already anticipating 75bps and should be ok with it as long as Powell’s language doesn’t seem too hawkish.
Levels for week:
Bull Bear line - 3870
Below 3870, We can see 3826, 3812, 3776, 3756
Above 3870, we can see 3886, 3900, 3912, 3950.

RTY UpdateMFI went oversold this morning, and you can see RTY is coiling.
CPI release tomorrow morning before market open, the market tanked before the last release, so if it doesn't tank before EOD it's a bullish sign.
Normally I would say this is a continuation pattern, but the algos need to fill he open gap. If it breaks upwards then the target is the resistance zone, upper orange line. Plan accordingly.
If you're short, you'll want to bail tomorrow if the market goes green at all. I'm all cash, even garbage will float on a rising tide. Wouldn;t surprise me at all if they pump even shitcoin.
