Rune

Rune/Usdt why you shouldn't be bearish.From the bottom we have been trading Rune and it have been profitable, and I don't think the bulls are done yet.
For the bulls to break the resistance line around 13$, I believe this channel have to be in play
Which would result to a break out. Validating the double bottom you can see at D1
I am still bullish on Rune and hopping to see more momentum.
I would like to hear your opinion on RUNE usdt and how you plan to trade it

MAGNIFICENT CHART IN DAILY USDT RUNE - OPTIMISTIC PROJECTIONTechnical analysis regarding the price of THORChain in relation of dollar Tether for the next scenarios, based on daily movement.
disclaimer
*** In accordance with CVM Instruction No. 598, of May 3, 2018, Art. 21, I declare that the recommendations of this analysis reflect solely and exclusively my personal opinions and perceptions and that they were prepared independently and autonomously. Not being considered a purchase and/or sale recommendation. ***
Any questions do not hesitate to contact me. I'm happy to be able to help you in the best way I can. 🙏

$RUNE - FSS Indicator gave you 2 chances to enter. "Don't short the Rune" is in vogue at the moment. Thor's chain has seen its bottom.
If you disregard the following...
-Bullish divergences
-Complete corrective EW structures. (ABC running flat in this case)
-Greatly reduced bear volume at the bottom
...you still had the solid Buy signals that the FSS Indicator (Floki's Secret Sauce) had printed on the 12H candle close.
On Feb 28, you had an entry just above $4. On March 9th, you had a buy signal print after a red candle! That's a rare and very bullish sign. This signal had your entry at $4.89.
Now on the TA side, we actually couldn't ignore the bullish divergences, the completed flat and the low bear volume. Within the bounce, we can count subwaves 1 & 2 for sure. With the 3 either almost done, or done heading into 4. Now with the guideline of wave alternation, I would expect RUNE to bounce above $6 in the case that wave 3 is actually done.
Safe trading to all!

⚡RUNE needs to take a breathIn my opinion BINANCE:RUNEUSDT rally needs to take a break. The last 3 day the price was moving up in a rising wedge formation with lowering volume and bearish divergences all across the board. The price just broke the dynamic support and I think it is now headed towards 8.00 - 7.00$ to complete wave (4)
Take profit: between 8.00 - 7.00
!!-- always DYOR and remember about risk management 👌

RUNEUSDT - SETUPRUNEUSDT price is moving aggressively and reached a critical resistance, but bulls looking in strong power they are trying hard to break that level. If they do so then a new horizon will be there for RUNE. Let's see how price action reacts.

RUNE - THOR Chain (1D)RUNE has seen a strong rally above the 150 MA - very bullish, avobe the 8 MA
Currently extending in overbought RSI, fast and slow.
Looking for price to top at the red dashed arc, and complete the 5th wave on the (1D) and begin an ABC correction on a 5-3-5 EW count.

Rune/UsdtRune just finished testing the H4 channel which has been holding since the resent bull run from 2$ and now 10$.
Following the recent market recovery many believe that Altseason or Bull Run has commenced.
However I can see some ending diagonal expansion pattern, Which currently the support is at 10.300 which if holds will drive the trend to another higher and the resistance is around $12.900 - $13.00
How ever if you felt it's now time for the bears to kick in, maybe opening a sell position below 10$ and riding till the H4 channel support maybe a good idea.
Whichever way you choose trade safe, and always secure your account.
Kindly leave your opinion on the comment section
Plz like and follow
Thanks

$RUNE, Highest daily volume in a year..$RUNE
Highest daily volume in a year..
Just a little push from here and this may start trending up
UCTS signalling buys on the 1D and 2D timeframes

$RUNE PUSHING TO $11-$11.6 (1H)Looking at the Strong upward momentum, $11 will be reached and for the weak resistance, the wave can break easily and head $RUNE towards $11.6

$RUNE is crossing $11.Looking and the momentum wave pushing upward toward $11 and above. Weak resistance will be broken with it if $RUNE continues with such Force

THORChain (RUNE)Happy Nowrouz
Happy New Year my dear Persian fellows
and hope yall enjoy crypto Spring as well
Today we gonna talk about one of the good crypto projects
THORCHain is a decentralized liquidity protocol that allows users to easily exchange cryptocurrency assets across a range of networks without losing full custody of their assets in the process. with THORChain, users can simply swap one asset for another in a permissionless setting, without needing to rely on order books to source liquidity. Instead, market prices are maintained through the ratio of assets in a pool ,see automated market maker. The native utility token of the THORChain platform is $RUNE
we just passed 3 Billion Marketcap and 4 Billion is on the way too
what do you think about Rune?

THORChain (RUNE) with bearish divergence - correction healthyTHORChain (RUNE) with bearish divergence on RSI - correction healthy
A correction to volume support at $6.37 would be healthy and not concerning for Bulls.
At least at FIB golden pocket ($12.13-$12.60) a correction might start.
What do you think?
Drop me a nice comment if you'd like me to analyze any other cryptocurrency or do another comparison.
*not financial advice
do your own research before investing

RUNE (RUNEUSDT) mid to Daily tf Range Updated till 26-3-22RUNE (RUNEUSDT) Mid-tier to Daily timeframe range. if you look at it even with intermediate trader's prospective its a profitable coin. specially a asset thats moves a lot within its respected zones range is a profitable asset. it provided some decent midtier timeframe setups too and it had swing and position traders setups. it was possible by look at its volume it had some quality buyers for now. if retail interest keeps on it maybe it act same.

RUNE potential targets THORCHain is a decentralized liquidity protocol that allows users to easily exchange cryptocurrency assets across a range of networks without losing full custody of their assets in the process.
I'm showing the possible targets that you can trade them when the price reach them.
A possible SHORT is at $10.00 and $13.15
A possible LONG or Spot Buy at $7.00 and $4.00

Currently Shorting RuneLooking to take a short on RUNE
A healthy pull back is needed after the recent rally.

RUNEUSDT - SETUPRUNE price has just moved positively after breaking the descending channel and flag, let's see how the price reacts.

RUNE AT DOUBLE TOP RSI AND VOLUME DIVERGENCEWe successfully scalped rune selling zone previous day. Sort at 9.5 and Exist at 8.9 and entry at 9.2 exist at 8.8.
Now two possibility of Rune in few days. One is metaverse and other is short term price falls up to 6.6-6.8.
As you see double top in 4 hours candle. With declining volume and RSI divergence.
One can take a short positions on basis of RSI. In my experience RSI will hit 59.9 then price is around 8.9. So open sort at 8.9 and DCA at 9.3. Stop loss 9.8
Target 1 8.6, Target 2 8.1 and target 3 7.6 Target 4 6.8.
Ultimately Rune will head towards ATH (Weekly Volume is Increasing and All time High).
To do this rune will slowly fall to 6 dollar zone to swap liquidity and create fear. When few peoples are in trade. Then within 2-3 days it will conquer 11 dollar zone.
Don't open new long above 8 dollars. BTC will decline which results in RUNE correction or pullback to 6.6-6.1 dollars.
Parallel Channel will break as in micro frame like 30 minute price showing bounce but with less volume.

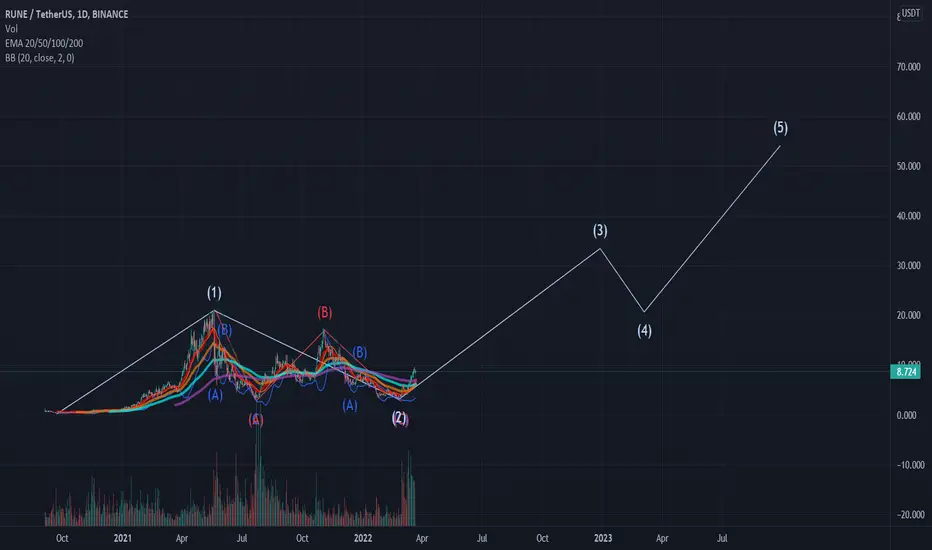
RUNE/USDTesting/tracking elliot wave theory. Please do not trade off idea without S/L. Not financial advice.
Link to previous chart:
The chart looks similar to audio chart with a double three corrective wave. Currently we're below the .238 fib levels with a double bottom that played out. A lot of charts are looking similar to these and we're in accumulation zone. Either we resume up for the wave (3) impulse wave or we get another corrective wave. Everything depends on BTC's movement and a triple three corrective wave is still at play (appears more frequently in a bear market). Despite all of the crazy things that has been going on and cryptocurrency is still going strong, I don't think we will see a bear market anytime soon, at least another year up. BTC was at 3k in march 2020 so it's only normal that we pullback a little. 3k to 42k is 14x. 69k to 42k is a healthy 35% pullback. Anyways this is the wrong chart to talk about btc lol happy trading if you're using this chart.
Time to Look Bearish on RUNERUNE had a spectacular run over the past week. We know a pullback is likely coming sooner than later, and it looks like the time has come. Price has been losing momentum over the last 24hrs and the daily uptrend has just broken bearish. Waiting for a lower low on the 4hr if you are conservative.

RUNE reversal shortPrice made big run up, getting rejected at daily resistance / over extended. Price is now making lower lows as of recent price action indicating a reversal. Price formed head and shoulders pattern on 15 min chart with a 61.8% retracement from high to low. Bearish divergence on 15 min recent bullish action.

RUNERUNE is trying hard to go above the resistance area but gets multiple rejections. The big wick shows heavy selling and price rejection. RUNE needs to close a daily candle above $9 to get bullish momentum. If RUNE is unable to go above $9 then we will see a test of the lower support area. This is no trade zone.

Market Update - 21 Mar 22 - Sunday Retracement, BTC Still StrongBTC had its big retracement for the day on Sunday
4hr flushed out late and weekend longs, but held the
important level of 40.7k.
ETH moved very similarly but rejected its monthly open
Other than that just waiting for the NY open to see what the
general markets are doing, other than that we are still
in this high timeframe range.
