RUNERUNE is now testing the major resistance of the $9 area. If RUNE breaks this resistance level and hold above it then we see good upside movement. The next resistance is $9.90-$10.15 area and $12.85-$13.00 area. The local support is $7.50-$7.60 area and major support is $5.45-$5.65 area.
Rune

RUNE potential profitable LONG above 7.900It's a nice and simple chart for $RUNEUSDT
It came as an unexpected drop today for RUNE considering as JASMY and WAVE have been holding and running an uptrend.
However, on the upside, as BITCOIN seems to rally up, if RUNE breaks through 7.900 price mark, we will see a continuation to above ~8,100 levels, and higher.
It is best to watch the 15m chart with a clear view on the 4h as RUNE has good trading volume currently.

$RUNE could be headed to $14, then $75$Rune has been showing huge volume and huge strength lately. On the weekly timeframe we can see an RSI "breakout" of a descending trendline, as well as strong candles in the price action. Upside resistance might show up at $14~ or so which is the downtrend line, then the measured move could take us to around $75. I dont expect to break out of this setup in the first go, some pullbacks are expected.
On a fundamental level, RUNE is solving some of the issues with swapping assets cross-chain which is a huge paint point in crypto currently. Their tokenomics is designed so that as the network grows in TvL (total value locked), upwards price pressure is put on the token.
Not financial advice, do your own research.

RUNE USDTBINANCE:RUNEUSDT
A long idea with a low risk.
Entry: 7.800
Stop Loss: 7.653
TP: 8.407, 9.223

#RUNE, Following the bullishness across the board#RUNE
Following the bullishness across the board
Looking good if it can go for the 6$ area w/ volume at strong levels not seen since August 2021
UCTS showing a potential Buy signal on the 2D timeframe
$RUNE


rune futures trade setup quick tradeRune broke down from its uptrend support trend line and currently forming a small descending broadening wedge which has a probability for 70% of breaking to upside.
this is a quick trade set up buy on support and sell/short on resistance, watchout for breakout and new trend formation.

RUNE double bottom #RUNE/USDT
$RUNE shaped double bottom pattern and head up to descending resistance that is around 0.382 fib level of swing down.
🐮 if price break out from descending resistance, it will increase to 2 fib level to complete the double bottom pattern.
🐻 rejection from descending resistance can drop price to support zone around $6.

RUNEUSDTHello Crypto Lovers,
Mars Signals team wishes you high profits.
We are in the daily time frame. The price moved up nicely after hitting the support zone and is now at the resistance zone. If it is rejected from here, it will move down to the support areas and if it is broken, it will move up to the next resistance zone.
Warning: This is just a suggestion and we do not guarantee profits. We advise you to analyze the chart before opening any positions.
Wish you luck

The ax is not that heavy! But it will go down anyway! RUNE looks tasty...... But... due to the oscilations of Bitcoin is very likely that he will eventually re-test the support.

RUNE ASCENDING PARALLEL CHANNEL The trend is your friend until it ends. short term trade setup.
#rune #chilltrader

RUNE/USDT 65% profit within a week#RUNE/USDT Profit Update:-
$RUNE currently trading at $6.40 and went upto $6.75
As I mentioned in Last post that was Retest zone.
And strong bounced from Retest level.
Now 65% up from our entry.
Congrats for Huge profit 65%
Entry:- $4.10 filled ✅
You cam book profit if you are happy.
And You cam placed stop loss at entry level $4
I am expecting $17 in mid term.
Exit below $3 ( Only for Long term HODLer )
Targets:- $17/$43
Support:- $4/$3
Resistance:- $8/$12/$17

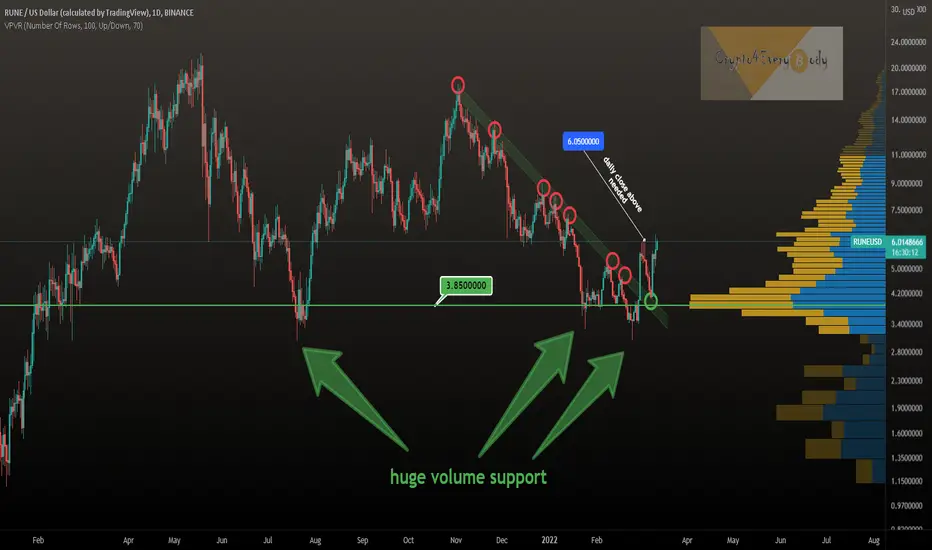
THORChain (RUNE) with confirmed breakoutTHORChain (RUNE) with confirmed breakout of price resistance trendline by daily close above $6.05.
Will this happen today?
What do you think?
Drop me a nice comment if you'd like me to analyze any other cryptocurrency or do another comparison.
*not financial advice
do your own research before investing
rune USD long rune today made some nice gains I expect some retrace and make some good cash with this coin 5 indicators support my idea so 5 groups of traders will place limit orders in that area think about it. SL we do small and TP big so with 1000usd you would loose 20USD and profit 360USD

$RUNE : SEND IT TO THE MOOONRUNE is consolidating inside a bullish descending triangle for the past weeks. This is a good bullish pattern with high probability of explosion to the upside and A similar pattern was found in SOLANA in last year.

RUNEUSDT 1D TA : Resistance ZoneAccording to the chart, after breaking the downward trend line and completing the pullback, it has reached the resistance range. In case of failure of this range, we have the possibility of increasing the price. In case of failure, resistance range is recommended for purchase.
Its not Buy or Sell SIGNAL
DYOR
BY : Mohmad Teriz - @AtonicShark

Rune Long@RUNE is breaking through the descending trendline and the resistance level. In case of daily candle close above the resistance, bullish movement to 8,4$ is possible

RUNE ResistAttention, My signal is not 100% right, So
Dwyor and use your analysis before you join
my signal.
This is the reason why i believe that rune will turn down :
1. There is strong resist weekly
2. Testing Fibo 0.618
3. Testing RSI trendline (still not confirmed breakout)
4. BTC still downtrend

is RUNE about to Fall?After checked in 30m, 1h and 2h timeframes, i trace some pivote zones that i considere relevant for this analysis.
As we can see in chart, 3rd Elliott's wave already finished but i only focus myself from 5th wave to C Elliott's, also seems in 2h chart that Wyckoff move for complete supply is about to be reached to it creates a triangle which also match with Elliott's and Wyckoff next moves.
Regarding indicators i saw high momentum in squeeze indicator (yellow crosses), no MACD, CRSI divergences even that i saw CRSI above 97 which indicates for now that RUNE is overbought and bearish move is around the corner.

Short RUNE Potential bearish tradeToday we have another good opportunity risk reward short entry, for this bearish market.
In this case I am looking at some anomalies(big pumps without a reason inside a bear market) and short them when I believe they are close to top/ATH
Key points:
Type of entry : Short
Take profit level 1 : 5
Take profit level 2: 4.5
Stops loss : 6.07

Ascending GuardAfter completing the abc correction wave and breaking the downtrend line and completing the pullback, we expect to climb.

$RUNE long$RUNE bounced off the ascending trendline and the support level. Bullish movement to resistance level at 6$ is likely to happen.

RUNE/USDT Is potential to 10x from here#RUNE/USDT TA Update:-
$RUNE currently trading at $4.20
As per chart this is bullish in mid term.
Parallel Channel resistance already broke out.
And now rested at support level.
I am trying to accumulate at dip.
Long term I am expecting $17 and $43
Strong support is $3.10
If hold this support then it will give huge returns.
Its can give 10x returns in mid term.
Entry:- $3.10-$4.10
Targets:- $17/$43
Stop Loss:- if HTF candle close below $3
