POLLBACK FOR BEAR TREND
RUNE/USDT
SELL-SHOR
✓ ENTRY : - 1.777 - 1.852
1: 1.701
2: 1.617
3: 1.522
4. 1.404
🪄 Stop | Loss : 2.040
moey management for entry in position if as this analytic as for entry position.
wait for come to zone sell
RUNEUSDT

Dont RUNE it! Elliottwave count. If you find this information inspiring/helpful, please consider a boost and follow! Any questions or comments, please leave a comment! Also, check out the links in my signature to get to know me better!
Leaning on this count for now.
A return to 3$ would be Ideal if it turns here.
Cheers!


RUNE/USDT BULL RUN? I am optimistic about this altcoin even if I expected a pullback already at this level.
Resistance : 2,6 - 3,35
If there is a rejection, wait for the setup for long 1.68-1.7
Marked the zone that is for investment.

RUNE about to pump like GAS and CYBERRUNE UPDATE: RUNE created rounding bottom so far and currently facing supply zone…. In short, I’m expecting a healthy pullback to 2.27 and I will long and buy in spot from there but market is so bullish now and nothing is ready to do any correction as they are all holding onto there support….
Anyways, if RUNE did decided to do a little correction or not… What I know is that once RUNE breakout from 3.438 on daily TF and flip it to support…. Nothing can stop it not to see $7
So, keep in watch for a good run up
Follow for more market update
Can chat me up for trading setup

RUNE/USD - Bullet Train to $3Rune is on a clear trajectory to reach $3.
I don't see any big resistance until there.
Buyers are dominating and sellers may only return once the key resistance is it.
Bias is bullish on this price action.
Like and follow for more ideas!

$RUNE will drop in MayBINANCE:RUNEUSDT
Before we start to discuss, I would be glad if you share your opinion on this post's comment section and hit the like button if you enjoyed it.
Thank you.
Possible Targets
➡️Touched 10$
➡️Next target 0.5 lvl fib. 12$
➡️After next FRS meeting price can drop to test downtrend line fib on 1D timeframe in MAY 2022
Hope you enjoyed the content I created, You can support with your likes and comments this idea so more people can watch!
Disclaimer: Please be aware of the risks involved in trading. This video was made for educational purposes only not for financial Investment Purposes.
Don't forget sub and join my channels under this idea!

Big short on RUNEmy first published idea. Let's earn a lot... No matter of success of this idea I will continue and structurize my ideas to give you a maximum profit.

Big long after big short on RUNEDon't want to teach you how to count the waves or to stretch the fibo out... just simple - entry point, SL and TP. If someone interested, ask me in direct...

RUNE SHORT SETUPThe RUNE symbol is one of the bullish symbols of the market. But we have signs on the chart that show that the rise of the RUNE symbol seems to be over.
It can go back up to the specified range to collect orders and complete reversal waves. In the specified range, we are looking for confirmation to take sell/short transactions. Until this range is reached, it is risky to enter sell/short positions.
I specified the invalidation level, closing a candle above this level will violate the analysis
For risk management, please don't forget stop loss and capital management
Comment if you have any questions
Thank You

Very first impulse wave will be done around $3Weekly Chart
I figured out the impulse wave begin from 0.777
Now, it's trading around 1.975 and going up further with the target is also resistance around 3.0
That's 1.382 Fib from 2.025
I expect RUNE will pullback to 1.5 before come back to contention
Wait for next move

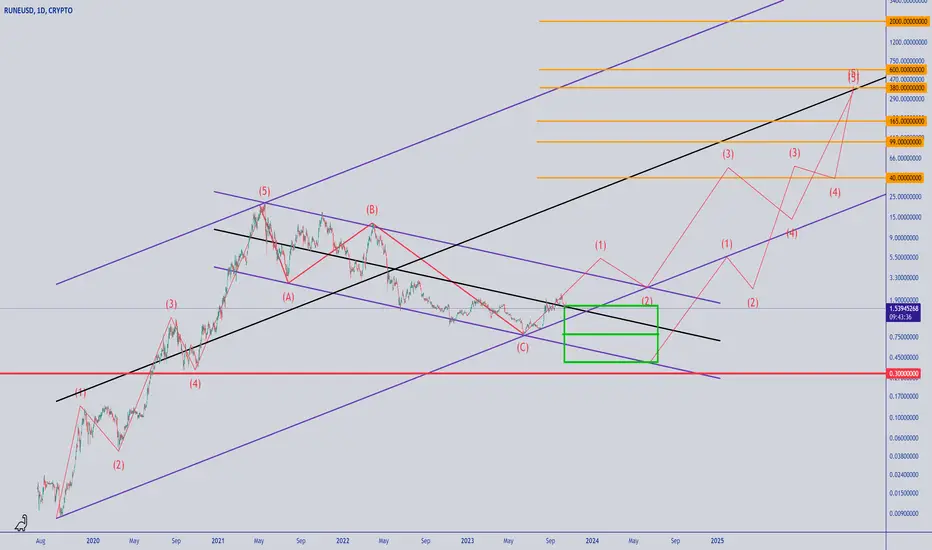
#THORChain #RUNE Long-Term chart analysis#THORChain #RUNE Long-Term chart analysis
According to the chart and the wave counter marked on it, the downward trend of this currency is probably over. And we can expect the beginning of its long-term upward movement. But since there is a possibility that we will have more decline ahead, so three entry steps are suggested at the current price of $1.53, then the price of $0.80 and finally the price of $0.40.
The primary target of the possible rise is the price of $40 by the end of 2025, which has a good risk-to-reward ratio.
The target are:
target1: 40$
target2: 99$
target3: 165$
target4: 380$
STOP LOSS: 0.30$
TIME: 1 YEAR
RUNE/USDT Scalp Chart AnalysisCRYPTOCAP:RUNE Technical Analysis
#RUNE is attempting to break past key resistance at $1.70
If this level is cleared, we could see a move towards $2 next
But rejection here would put $1.60 back to the test
Always wait for confirmation before entering any trades!
Let me know your thoughts on #RUNE below.
But remember to trade responsibly, have a plan, and never gamble with money you can't afford to lose. Patience and discipline are keys.

RUNEUSDTBINANCE:RUNEUSDT
I missed the entry point for the short position, but it is possible for the price to return to that point
⚠️Note:
In this type of signals, only the entry point and trade direction are specified, and stop loss and target are not determined.
If you are interested in entering these signals, please provide a stop loss and a logical market-based target.
⛔"Daily crypto market analyses I provide are personal opinions & not financial advice. Trading carries risks, so do your own research & seek advisor's help.#DYOR"
Don't forget to like and comment

Rune starting the wave 5 ?Opening a long position on RUNE. Wave 4 is probably completed.
Starting a last wave (5) to the upside before retracement.
R&R is optimal
Let's goooo

BEARING CONTINUATION ON RUNEUSDTRune coin has been trending up for some time being until it hit a resistant key level and rejected the level. Price came down to the previous Resistance turning Support and broke through. Made a restest and finally gave out a pin bar candlestick indicating a bearish continuation.
This is not a financial advice, seek analysis before entry...

RUNE/USD - Great Run, Now PullbackRUNE had a great run after its lending mechanism went live.
However, the price has hit a major resistance at $2.2 and it's unlikely the price will push higher at this time.
Momentum indicators are also turning a bit bearish after such a rally. So expect a pullback.
The area at $1.3 looks interesting for buyers.
Bias a bit bearish in the short term.
Like and follow for more updates!

RUNE/USDT Crucial Moment. Continue Upward or Broke the Support ?💎 RUNE is on our radar due to its significant movements. Currently, it's hovering in a pivotal zone that previously acted as daily resistance but now serves as support. At present, RUNE is in a retesting phase, with the candlestick patterns indicating several bullish rejections.
💎 This suggests that RUNE might be gearing up for an upward trajectory, possibly targeting the Bearish OB zone. Additionally, there's an FVG Area that RUNE might interact with.
💎 However, if RUNE struggles to maintain its position above this support and breaks below, there's a chance it could descend to the demand zone. Here, it might either exhibit a rejection or initiate a new upward leg. If it continues its downward trend, it might even reach the Strong Demand area.

RUNE on the way to 2.5 as plan!2h time frame
According to our previous analysis about RUNE, this Cup and Handle is doing well so far.
Here is the best timing to set protective stop to avoid unrealized profit gone.
Adjust SL from 1.414 to 1.95
Previous post as below.

RUNEUSDT - Buy SetupRUNEUSDT (1D Chart) Technical analysis
RUNEUSDT (1D Chart) Currently trading at $1.959
Buy level: Above $1.95
Stop loss: Below $1.55
TP1: $2.2
TP2: $3
TP3: $4
TP4: $5
Max Leverage 2x
Always keep Stop loss
Follow Our Tradingview Account for More Technical Analysis Updates, | Like, Share and Comment Your thoughts

RUNE Cup and Handle target 2.52h time frame
-
RUNE is creating a potential cup and handle srtucture, also in the phase of continuation structure, which pumping wave is 0.905 ~ 2.028. Critical resistance is obvious at 1.973, if RUNE can break above it then we can have higher target based on the cup and handle structure.
TP: 2.493~2.665
SL: 1.414

Falling Wedge, wait for breakoutChart 1H TF
I figured out a reversal pattern, Falling Wedge.
This pattern combines with Support zone around 1.7 that is very good for reversal.
So wait for a signal to confirm this pattern

Rising Wedge or Diagonal Wave | Short BiasChart 4H TF
I figure out a Diagonal Wave might be done around 2 or little higher
RUNE has Resistance by Previous High around 2 and Support by Ascending Trend Line
If my analysis is true, I expect RUNE will come back to 1.72 then up and down awhile
So wait and see what happen
