RUNEUSDT

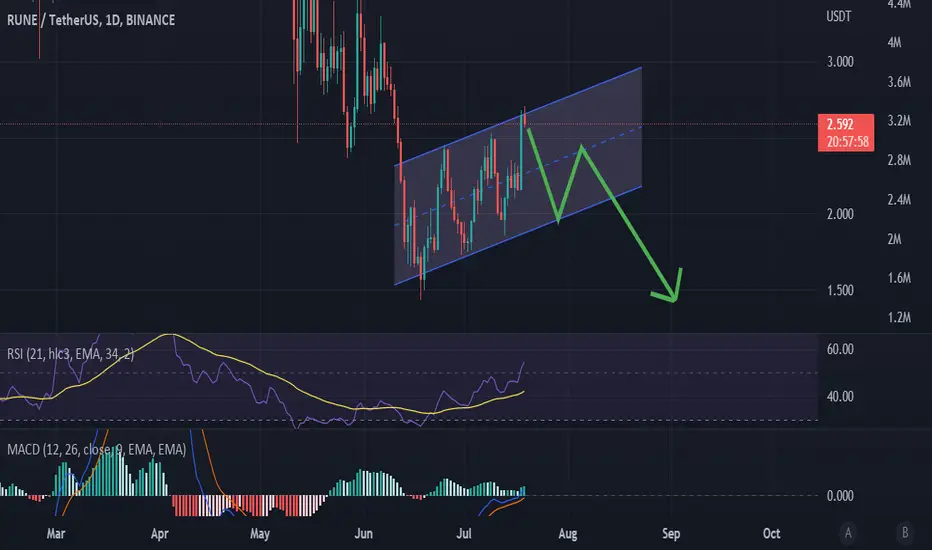
RUNE at lower level of upwards channelHas been consistently putting in higher highs and is currently at the bottom of the upwards channel its been following.
This could be a strong LONG entry, however there is a strong resistance level indicated by the box. This is where id be looking for entries based on how it reacts!

RUNE / USDT Rune coming back to retest 4H demand area to form a HH and keep holding bullish order flow minimum target will at Swing High

Runeusdt 4hThis is not financial advice
If brake this support you see rune berish
If rune not brake this support you see rune 3.400


RUNEUSDTthe market almost reach our buying zone after reaching target for previous selling zone with Impulsive sequence , we will wait till the zone reactivated again RR 3:1

RUNEusdt analysisEverything is clear in the chart
According to my previous analysis, which was done in a simple way
This is also located on the roof of the channel
**This is an analysis, do not consider it for buying and selling**

RUNE ANALYSISHere we can see RUNE running in a parallel channel
Hence need to touch the target according to pattern
Stoploss given in chart
thank you for supporting

RUNEUSDTHello Crypto Lovers,
Mars Signals team wishes you high profits.
This is a 4-hour-time frame analysis for RUNEUSDT
According to our last analysis on July 19, we expected a falling trend and at the present, this has happened and all of our targets are hit. In the current chart, we have R2 and R1 as the resistance areas and they involve the unsuccessful triumphs of the price to rise. And S1 is our support area which includes the support of the price at some points since the past. Here the price is fluctuating below R1 and we believe it will rise to R1 and at that point, it will face two scenarios. Either it is able to fix over this line and face more increase toward R2. Or it may lose the support at R1 area and start a decline to S1.
Warning: This is just a suggestion and we do not guarantee profits. We advise you to analyze the chart before opening any positions.
Wish you luck

RUNEUSDT Coin review, will it break through support or not?Hello trader👋 Today I prepared a new idea for you. Like and subscribe to the channel there is a lot of useful information✅
RUNE is testing the support that was previously resistance, I think it is still in this zone, after which we will go down to about $2.262

Rune Bearish countHave some interesting Elliott Wave price action on this one. Some nice potential impulses to play off of. This would be the bearish variant. Bulls really need to break above and flip 3-3.40. Could be done at this point but there is a potential for one more leg up, before either more sideway or another leg lower. If helpful, like, follow and boost. Cheers.

RUNERUNE/USDT we are looking for this coin to Retest one more time Our OB zone and to take LONG position

RUNE/USDT TRADE SETUP! READY TO PUMP 100%!!Hello everyone, if you like the idea, do not forget to support with a like and follow.
Welcome to this RUNE/USDT trade setup.
RUNE looks good here. Breaks out from the big symmetrical triangle in 6hr time frame. Expecting a big move to the upside from here.
Entry range:- $2.34-$2.44
Target1:- $2.72
Target2:- $3.02
Target3:- $3.44
Target4:- $4.44
SL:- For leverage ($2.22)
For spot ($2.00)
If you like this idea then do support it with like and follow.
Also, share your views in the comment section.
Thank You!

RUNEUSDTSignificant volume increase and double pattern in play. In indicators side, expecting bullish cross. However, I placed long already as risk/reward is very promising. Previously, Rune had very strange cycles of huge pumps and dumps.

THORChain (RUNE) - Renko chart updateTHORChain - Renko chart update
The last support line work pretty well - no RUNE has to break the next resistance line
Renko-Charts filter out the noise and give a clear TA picture
Tell me which Crypto you want to see as a Renko-Chart TA
*not financial advice
do your own research before investing


140% for RUNE?Buying right now with SL under weekly lows or under previous weekly candle lows... good R:R, quite RISKY trade...btc must stay stable or in the upside. Manage your risk
Not financial advice

RUNEUSDTHello Crypto Lovers,
Mars Signals team wishes you high profits.
This is a 4-hour-time frame analysis for RUNEUSDT
Here we have R2 which used to be a support area. R1 is our resistance line and you observe that the price was unable to rise. And S1 and S2 are the support areas which include the support of the price at some points. Now we have the price fluctuating over R1 and we believe it will rise to the height of R2 and then by a pull back to R1, it may start a rising trend again. Even it is possible for the price to lose the support at this area and face a decline to S1.
Warning: This is just a suggestion and we do not guarantee profits. We advise you to analyze the chart before opening any positions.
Wish you luck


RUNE/BTC Great Buy - Strong Strength SnapshotFollowers may request a strength snapshot of any cryptocurrency, so like and follow.
1) Strength Profile: Green and very strong.
2) Bull Bear Squeeze: Bulls are well in charge.
3) Money Flow: Is positive and increasing.
For now, RUNE/BTC is a great buy - Strong Strength Snapshot: Strength Profile 🟢 Bulls in Charge 🟢 Money Flow 🟢 I'm going long from 1150 sats.

RUNEUSDTHello Crypto Lovers,
Mars Signals team wishes you high profits.
This is a 4-hour-time frame analysis for RUNEUSDT
Based on our previous analysis on July 13, we expected a rising trend and now we see that the price faced a rise. In this chart, there is R2 and R1 as our resistance lines and show the unsuccessful attempts of the price in order to rise . Also, we have S1, S2, and S3 as the support areas and they include the support of the price at some points since the past. At the present, we see the price fluctuating below R1 and we believe it will rise over this line and by having a fixation at that area, more rise is waiting for it to R2. If the price loses the support, it will fall toward S1 and even more.
Warning: This is just a suggestion and we do not guarantee profits. We advise you to analyze the chart before opening any positions.
Wish you luck
