RUT Russell - possible big short next days & long term vision
so far ATH head is 1817 and major H&S still in play
double top 1817 and 1809 is finished and reversal trend should be here, another smaller H&S could be forming with the 1809 head
we could have a sharp and quick DROP to 1540 levels next days (unless major steep UP trend continues following days!)
update of main dates for DROPS in January/April in the chart
Russell

SPX - the BIG DROP starting 13th January 2021 - ATH & update
middle of H&S today!
SHORT from here for few days
ZIGZAG and UP to create a second shoulder before January DROP

RUT Russell ATH 1817 - a FINAL top of massive H&S - SHORT time!
today massive spike +7% to 1817.703 ATH on Russell - the middle of big H&S structure and major trend reversal towards the BIG DROP!
1817 beginnings of FED - the Second Bank of the United States founded
important days for H&S pattern in the chart


SPX - the BIG DROP starting 13th January 2021
today is the double top pattern (comes from my Russell calculations)
DOWN and UP till Jan, 10% ZIG ZAG patterns
the BIG DROP could be starting around from the double top symmetry 13th Jan 2021

RUT Russell - a main "TRIPLE CROWN" pattern could be evolving!
we could be heading to a second part of the main "triple crown" pattern
a final DROP should be postponed to mid Jan

RUT Russell 2000 - H&S 3tops - DOWN before UP?
reached 1574 level - matching levels for a left shoulder
expecting down moves before another UP and final ZIG-ZAG to 1610

RUT triple top - 22 December drop version
pattern is developing - update of the plan
decline starts around 22nd December

SPX - long for tomorrow - 3470?
LONG for tomorrow
high volatility and ZIG ZAG patterns for pre-election
DROP to low with recovery till early next year
THE BIG DROP in March 2021 (as in Russell related links)

RUT Russell 2000 - two next days?
H&S to build up a reversal trend tomorrow
reaching top levels day after (to finish a new channel resistance)
Friday reversal to DOWN trend

RUT Russell 2000 - short term LONG - Son & Father in H&S
UP tomorrow?
ZIG ZAG till US election
Finish of Head and move DOWN
part of a massive H&S - more in a related link

RUT Russell 2000 - The Big CRASH scenario? Jan/March 2021
Forecast with a long range so accuracy is less limited
Massive H&S?
Fibonacci spiral projection in confirmation
Long term SHORT, periods of LONG

Elliott Wave View: Near Term Support for Russell 2000 Futures (RElliott Wave view in Russell (RTY) suggests the rally from September 24 low unfolded as an impulsive Elliott Wave structure. Up from September 24 low (1426.20), wave 1 ended at 1530.80 and wave 2 pullback ended at 1490.70. From there, Index rallied and ended wave 3 at 1617.70 and wave 4 ended at 1563.10. Last leg higher in wave 5 ended at 1651.70. The 5 waves rally ended wave (1) in higher degree.
Index is now in wave (2) pullback to correct cycle from September 24 low as a zigzag before the rally resumes. Down from wave (1) high at 1651.70, wave ((i)) ended at 1622.6 and wave ((ii)) bounce ended at 1647.1. Wave ((iii)) ended at 1597.30, wave ((iv)) ended at 1607 and wave ((v)) of A ended at 1595.50. Bounce in wave B has ended at 1648.40.
Index is now in wave C lower which subdivides as another 5 waves. Down from wave B at 1648.40, wave ((i)) ended at 1626.80, wave ((ii)) ended at 1648.40, wave ((iii)) ended at 1607.6 and wave ((iv)) ended at 1623.90. Expect another leg lower to end wave ((v)) of C of (2) towards 1557.5 – 1592.14 before Index resumes the rally higher or bounce in 3 waves at least.

RUT - a diamond on Mt Everest TOP!
a DIAMOND reversal patterns on H&S top 1647
a DROP expect today or tomorrow
see more in my previous analysis

RUT US2000USD - Mt Everest top 1647!
Mt Everest reached! Officially 1647
This should be a TOP of a massive H&S 1608 - 1647 - 1608 pattern
Short to 1550/1520/1490/1430 levels UP and ZIG ZAG from there to 1608+
Nov 6th - the presidential election - should reach the second shoulder levels
the BIG DROP should be around 8th/9th December in this scenario

StockMarket Update : October Week #2Hope this idea will inspire some of you !
Don't forget to hit the like/follow button if you feel like this post deserves it ;)
That's the best way to support me and help pushing this content to other users.
Kindly,
Phil

RUT 1620 TOP heading down to 1490 in H&S pattern next few days
1620 is local top on RUT
H&S pattern to 1490 levels
after that ZIG ZAG uptrend to 1620 levels
final crash after Nov 6th from 1620
SPX, NQ in similar pattern

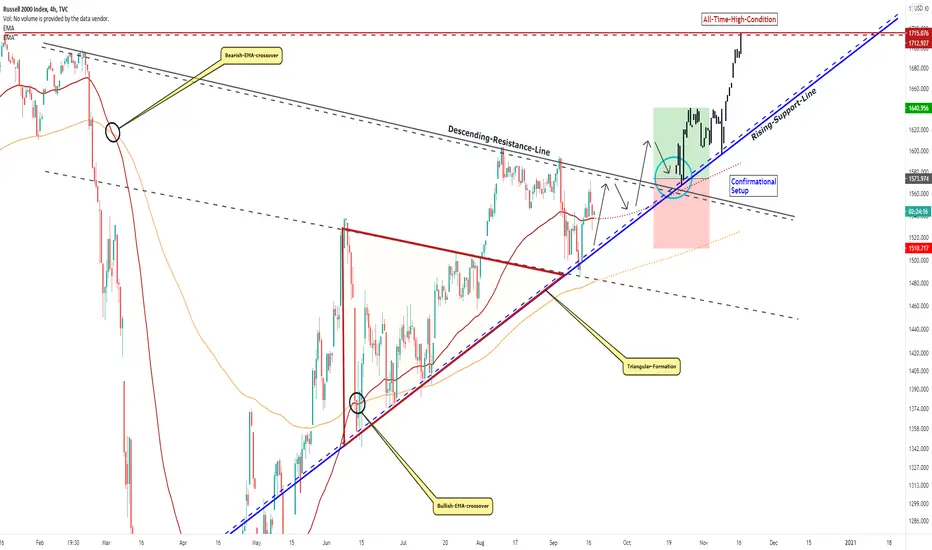
RUSSELL 2000, Above Preliminary Level, These Steps Can Follow!Hello Traders Investors And Community, Welcome to this analysis where we are looking at the RUSSELL 2000 index 4-hour timeframe perspective, the recent events, the current formational structure and what we can expect the next times. The main market and other indices like the SPX or DOW recovered steeply from the heavy corona-breakdowns and lows established this year where they already managed to form new all-time-highs, in this case, the RUSSELL 2000 is still below the major all-time-highs established before the corona-breakdowns, this does not mean it can change, however, therefore, it is important that the index shows up with the proper price-action and don't invalidates the possible bullish scenario substantially, therefore I detected all the important levels and possible outcomes we should consider for the index and its destinies.
Looking at my chart you can watch there the triangle-formation marked in orange which already broke out to the upside where it also bounced already from the upper boundary and the blue rising-support-line marked in my chart, what is also a good sign is that the index formed a bullish-EMA-crossover already before the triangle-breakout occurred, currently, as you can watch marked in my chart the index has still resistance at the descending-resistance-line marked in grey above the level, when the index manages to move above it this will cause a decent entry setup as the index has taken out its major resistance, as you can watch in my chart, this mechanism can be entered immediately aggressive in the current price-action or conservative when the breakout occurred, although the aggressive approach is also possible the conservative should be preferred.
In this manner, thank you for watching, support for more market insight, good day to you, and all the best!
“Trading effectively is about assessing possibilities, not certainties.”
Information provided is only educational and should not be used to take action in the markets.
$IWF Double Top 3 Lower High Bull FailureBuyers have created a double top from a few days ago which held prices down. Once sellers were able to prove they had the strength to create double tops, they then came in with 3 lower high bull failures completely derailing the bulls from the wedge breakout up. Now, with a fake-break of the wedge top and heavy bear momentum back in, sellers will be hunting for reasons to short down to wedge lows or, at the very least, the congestive lows / closes / wicks.

ridethepig | Nasdaq📍 This is another known position. Breakdown in 5 waves by testing 10,236; 9,548 and 8,859 .
Double zig zag is purely a tactical weapon. It is terribly compelling; even the most sluggish of buyers will be trapped here - driven to cover after the latest breakdown.
We shall open the next chapter in US Equities with four simple charts:
Dow:
S&P500:
Russell:
📌 In the coming sessions we can open up the short-term charts and start adding some interesting positions to the portfolio.
Sellers last move has been interesting of course, not because of the breakdown but because of the blow off top and profit taking that has taken place since. The somewhat theatrical looking pullback is no less imaginative than the move we played together in German Equities (DAX) earlier in the year:
If 8,859 is reached then we have the potential for another waterfall. The final combination will depend on whether we get market closures. As usual thanks for keeping the feedback coming 👍 or 👎.


Elliott Wave View: Support Area for Russell 2000 (RTY)Elliott Wave View of Russell 2000 (RTY) suggests the rally from July 31,2020 low has ended at 1605.70 high as wave 3. Up from July 30 low, wave ((i)) ended at 1482.60 high and wave ((ii)) dips ended at 1467.80 low. Index then extended higher in wave ((iii)) towards 1552.60 high. The internal subdivision of wave ((iii)) unfolded as 5 waves impulse Elliott Wave Structure. Wave (i) of ((iii)) ended at 1510.60 high and wave (ii) pullback ended at 1493.70 low. Rally higher in wave (iii) then ended at 1551.60 high, followed by wave (iv) pullback, which ended at 1543.40 low. Wave (v) then extended higher and ended at 1552.60 high.
Afterwards, the Index did a pullback in wave ((iv)), which ended at 1534.20 low. Finally, wave ((v)) higher ended at 1605.70 high. This final move completed wave 3 in higher degree and ended cycle from July 31 low. Index is currently correcting that cycle within wave 4. The correction is unfolding as a double three correction, where wave ((w)) has ended at 1560.90 low. The bounce in wave ((x)) ended at 1589.60 high. Wave ((y)) remains in progress right now. As long as 1451.10 low stays intact, expect the dips in 3,7 or 11 swings to find support for more upside. The 100-161.8% extension of wave ((w))-((x)) where ((y)) can end is at 1516.76-1544.71 area and is shown with a blue box. That area if reached later can produce 3 waves bounce at least.

RUT Triangle Pattern for a pending Wave (C) pullback The same predicament exist in the RUT as the SPX. RUT is forming a triangle pattern that could unfold into wave (C) corrective wave lower. The immediate pullback should take us back into 1250 downside target facing significant resistance ahead at 1542. One more push down into 1250 before we close out our bearish biased butterfly spreads.
