Russell
June 21 Market Update | Technical, Fundamental, NewsDescription:
An analysis for the week ahead.
Points of Interest:
4-Day Island; Gap; 4-Day Balance.
Technical:
Mixed messages provided after equity indices broke the short-term, momentum driven uptrend, and corrected on June 11. Overall, the island of balance left behind, after the market sold-off, is still intact and will offer resistance on upward auctions. If the market trades through that area, then sentiment has changed and the initiative activity that drove prices lower is no longer present.
Monday displayed a rejection of lower prices after overnight activity started off weak, on a gap down, but quickly corrected into the regular trading session, impulsing higher, through the $3,000 S&P 500 level.
Tuesday’s trade blew through most of the resting offers overnight, into a low-volume area, on a record increase in U.S. retail sales. Later on, after a choppy open, the market established good excess on the lower extreme, and pinned near the $3,100 level.
Wednesday and Thursday’s action was fairly muted as the market continued digesting the upward correction going into Friday’s simultaneous expiry of options and futures tied to index products.
Despite gapping to the high end of the week-long balance overnight, Friday’s trade was volatile and lacked conviction to continue into the resting liquidity at and above the $3,135 area.
Putting everything together, the picture points to the potential for a volatile week ahead. With the removal of S&P open interest, gamma (i.e., the sensitivity of options to changes in underlying price) imbalances and hedging activity could heighten volatility. If liquidation continues into the coming week and value moves lower, then the near-term bullish narrative is no longer intact.
Scroll to bottom of document for non-profile charts.
Key Events:
Existing Home Sales; National Activity Index; Building Permits; PMIs; New Home Sales; Home Prices; Q1 GDP; Durable Goods; Trade Balance; Trade Inventories; Initial Claims; Continued Claims; Personal Income; Personal Consumption; PCE; UoM Sentiment June Final.
Fundamental:
Mortgage applications jumped for the 11th week in a row. bit.ly
Traffic at supermarkets and merchandise stores near normal. bit.ly
Oil prices will average less than $60 to ensure production. reut.rs
U.S. and Canadian oil and gas rig count falls to record lows. reut.rs
On June 26, Russell will implement a record index reconstitution. bit.ly
China stressed as repo rates and yields climb, liquidity thins out. bloom.bg
Fed shifts away from bond ETFs to a special, diversified index. bloom.bg
ECB’s boost to pandemic bond buying isn’t enough. bloom.bg
No indication BOE will renew its asset-purchase program. bloom.bg
Companies to ditch revenue focus, hone in on market share growth. bit.ly
Facebook Inc (NASDAQ: FB) acquired a mapping technology company. bit.ly NASDAQ:FB
Square Inc (NYSE: SQ) acquired a Spanish P2P payments app. bit.ly NYSE:SQ
Apple Inc (NASDAQ: AAPL) closes stores due to resurgence of COVID-19. reut.rs NASDAQ:AAPL
Kroger Co (NYSE: KR) posts stronger sales, profit amid pandemic. on.wsj.com NYSE:KR
Unemployment claims decline, but at a slower rate. bit.ly
Shopper engagement is higher with mobile ecommerce apps. bit.ly
High-yield downgrades drop from March and April readings. bit.ly
MIT, Harvard, and others on how capitalism will emerge after COVID-19. bit.ly
Startups focused on saving time and money may thrive. bit.ly
Walmart Inc (NYSE: WMT), Shopify Inc (NYSE: SHOP) partnership a credit positive. bit.ly NYSE:WMT
Facebook Inc’s (NASDAQ: FB) Brazil payments service cuts into bank profits. bit.ly NASDAQ:FB
GrubHub Inc (NYSE: GRUB) acquisition a credit negative for U.S. online food-delivery. bit.ly NYSE:GRUB
EU solvency rule amendments to improve bank capital ratios and support the economy. bit.ly
No-deal Brexit to compound risks for sectors hit by pandemic disruption. bit.ly
Americans increased spending while working from home. bit.ly
France lifts most of its COVID-19 restrictions. on.ft.com
AT&T Inc’s (NYSE: T) sale of Warner Bros. would fetch around $4 billion. cnb.cx NYSE:T
USD to weaken as Fed commits to QE infinity. bit.ly
ARM-based Macs to expand Apple Inc’s (NASDAQ: AAPL) PC market share. bit.ly NASDAQ:AAPL
U.S. natural gas extraction efficiency improves, increasing production rates. bit.ly AMEX:UNG
Air maintenance firms brace for a 75% sales decline this year. reut.rs
The U.S. weighs a $1 trillion infrastructure plan to spur the economy back to life. bloom.bg
Loan default rate approaches 4% on imminent energy bankruptcies. bit.ly
Airports resilient despite pandemic fallout. bit.ly AMEX:JETS
Sentiment: 24.4% Bullish, 27.8% Neutral, 47.8% Bearish as of 6/20/2020. bit.ly
Gamma Exposure: (Trending Lower) 2,194,659,186 as of 6/20/2020. bit.ly
Dark Pool Index: (Trending Higher) 52.5% as of 6/20/2020. bit.ly
Product Analysis:
S&P 500 (ES): AMEX:SPY TVC:SPX
Nasdaq 100 (NQ): NASDAQ:QQQ TVC:NDX
Russell 2000 (RTY): AMEX:IWM TVC:RUT
Gold (GC): AMEX:GLD
Crude Oil (CL): AMEX:USO AMEX:DBO AMEX:USL
Treasury Bonds (ZB): NASDAQ:TLT
Disclaimer:
This is a page where I look to share knowledge and keep track of trades. If questions, concerns, or suggestions, feel free to comment. I think everyone can improve, especially me.
In no way should this post be construed as investment advice.

Crazy analysis on russell. dont respect it or listen to this.This is not all inclusive. I know nothing. just observations.

RUT Short Position Update: Thu Jun 18, 2020RUT Short Position Update: Thu Jun 18, 2020
13:31:57 (UTC)
Thu Jun 18, 2020

RUSSELL Wave A or wave 1?From my last RUSSELL analysis I was mentioning the eventuality of an end of W5. This seems to happen now.
I am now looking at this downward leg which could a simple ABC correction if A bounces back at the level of the previous 4 wave...
Or if it slips lower confirming my theory of a bear market complex correction.


May 17 Market Update | Technical, Fundamental, NewsDescription:
A simplified analysis for the week ahead.
Points of Interest:
Monday High; Tuesday Spike, Wednesday LVNode; Thursday Low; Friday Value; Composite Profile; Balance.
Technical:
There is no clear direction in the market. Nasdaq relatively strong. Russell, Dow, and NYSE are weaker.
On Monday, we made it into the $2950 zone of resting liquidity, prior to putting in a weak double top.
Tuesday left value behind, liquidating and closing on the lows, which pointed to a continuation lower.
Wednesday and Thursday accepted the spike and built a base above the $2760 resting liquidity.
Thursday and Friday’s up-action was weak, relative to the earlier selling, and left value overlapping, in balance.
With these past developments in mind, the market has been coming into balance over the past few weeks, digesting information, building value, shaking out weak hands. Aside from remaining in balance, the market could extend directionally, or extend and return to balance quickly. Taking out Thursday’s low of $2760.25, my immediate targets on the downside include $2730 and $2630. Upside targets include $2910 and $2950.
Scroll to bottom of document for non-profile charts.
Fundamental:
Key Events: Earnings; Housing Starts; Existing-Home Sales, Housing Market Index, FOMC Minutes; Initial Claims.
Detailed look at April job losses. bit.ly
Georgia’s early reopen has not resulted in a surge of hospitalizations or death. bloom.bg
NYSE to reopen trading floor, dampen intraday volatility. on.wsj.com
Demand shock to take the upper hand over supply shock, depressing inflation pressures. bit.ly
May to join March and April as best months for investment-grade bond issuance. bit.ly
Telemedicine popularity means growth for prescription delivery. bit.ly
Money managers expect Trump to retake White House in November. bit.ly
Slump in aviation hit $GE harder than other suppliers. bloom.bg
Canada to extend wage subsidies. reut.rs
High-growth companies target America’s heartland. bit.ly
Puerto Rico’s economy to benefit if pharma returns. bit.ly
High technology North America’s biggest corporate borrower. bit.ly
Auto sales are resilient despite coronavirus. bit.ly
Low cost, laid-back lifestyle has tech flocking to Texas. bit.ly
$FCAU in talks over $6.8B state-guaranteed loan. reut.rs
$UBER, $GRUB eye merger. bit.ly
Consumer confidence signals cognitive dissonance. bit.ly
Fitch expects record downgrades in 2020. bit.ly
More than one-third of the workforce was damaged by the crisis. bit.ly
Oil market pricing in tighter supplies due to production cuts, rising demand. reut.rs
Recovering oil demand could drive the market into deficit by July. reut.rs
$FDX CEO more optimistic than most on industrial rebound. bloom.bg
Full Saudi Arabian tankers steam towards the oversupplied United States. bloom.bg
Though overall economic well-being improved, financial well-being widened. bit.ly
$ABBV closes Allergan acquisition, increasing leverage. bit.ly
Columbia’s higher fiscal deficit limit points to fiscal deterioration. bit.ly
Sentiment: 23.3% Bullish, 26.1% Neutral, 50.6% Bearish as of 5/16/2020. bit.ly
Gamma Exposure: (Trending Lower) 951, 835, 268 as of 5/16/2020. bit.ly
Dark Pool Index: (Trending Higher) 48.4% as of 5/16/2020. bit.ly
Product Analysis:
ES: TVC:SPX , AMEX:SPY
NQ: TVC:NDX , NASDAQ:QQQ
RTY: TVC:RUT , AMEX:IWM
YM: TVC:DJI , AMEX:DIA
NYA: TVC:NYA
GC: AMEX:GLD
CL: AMEX:USO , AMEX:DBO , AMEX:USL
NG: AMEX:UNG
ZB: NASDAQ:TLT
Disclaimer:
This is a page where I look to share knowledge and keep track of trades. If questions, concerns, or suggestions, feel free to comment. I think everyone can improve, especially me.
In no way should this post be construed as investment advice.

Elliott Wave View:Russell 2000 (RTY) Reaching Short Term SupportAs a larger context, the rally in Russell 2000 (RTY) from 3.19.2020 low took the form of an impulsive structure. Up from there, wave (1) ended at 1180.3 and wave (2) pullback ended at 1029.7. Index then resumed higher in wave (3) and ended at 1265.6 and wave (4) pullback ended at 1148.5. The final leg wave (5) ended at 1374. This move also completed wave ((1)) in higher degree and ended cycle from 3.19.2020 low. Wave ((2)) pullback is in progress to correct cycle from 3.19.2020 low in 3, 7, or 11 swing before the Index turns higher again.
The 1 hour chart below shows the correction in wave ((2)). The internal subdivision is unfolding as a zigzag Elliott Wave structure. Down from wave ((1)) high at 1374, wave (A) ended at 1220.1 as an impulse in lesser degree. Wave 1 of (A) ended at 1353.6, wave 2 of (A) ended at 1370.60, wave 3 of (A) ended at 1236.5, wave 4 of (A) ended at 1258.80, and wave 5 of (A) ended at 1220.10.
Up from there, wave (B) bounce ended at 1341.6 as a zigzag in lesser degree. Wave A of (B) ended at 1303.7, wave B of (B) ended at 1245.6, and wave C of (B) ended at 1341.70. Wave (C) is now in progress as 5 waves impulse and can see more downside to reach 1150 - 1187 area. This is the 100% - 123.6% Fibonacci extension of (A)-(B). From this area, Index may see buyers for more upside or 3 waves bounce at least.

RUT2k Short Entry (Updated) 20:01:24 (UTC) Wed May 13, 2020See previous trade entry prior to the New York open this morning.
20:01:51 (UTC)
Wed May 13, 2020


Russell 2000 Target 871Market ready for another vicious leg down. Russell 2000 could potentially touch 871.

Diary | 2/5/20 | RUT SpreadDescription:
Selling into some weakness on the RUT.
Justification:
- Directional Play? No, neutralizing delta's on existing RUT positions.
- Technical: Below the 20 and 50-day moving averages.
- Fundamental: Bullish long-term.
If/Then:
- Take profit? @50%
- Where will you hedge? $1725
Strategy Details
- Short and Long legs: $1615, $1600
- Short Delta: 0.14
- Duration: Feb 21 Expiration

Elliott Wave View: Pullback in Russell Should See SupportShort term Elliott wave view in Russell (RTY_F) suggests the Index ended the correction from January 17, 2020 high in wave (4) at 1609.56. It has since resumed higher in wave (5) and the internal subdivision is unfolding as a 5 waves impulse Elliott Wave structure, The Index still needs to break above wave (3) at 1715.1 to avoid a double correction in wave (4). However, other US Indices such as YM_F (Dow Jones Futures), ES_F (S&P Futures), and NQ_F (Nasdaq) have broken above the previous peak, supporting more upside in Russell as well.
Up from February 1 or wave (4) low, wave ((i)) ended at 1629.8 and wave ((ii)) pullback ended at 1619.80. Index then resumes higher in wave ((iii)) towards 1678.8 and pullback in wave ((iv)) ended at 1665.90. Index resumes the final leg higher in wave ((v)) towards 1695.20. The 5 waves move higher completed wave 1. Index is now within wave 2 pullback to correct cycle from February 1, 2020 low before the rally resumes. As far as pivot at 1609.56 low stays intact, expect pullback to find support in the sequence of 3, 7, or 11 swing for further upside.

Elliott Wave View: Russell Impulsive Rally In ProgressRussell 2000 (RTY_F) shows a 5 waves impulse Elliott Wave structure from August 26, 2019 low. In the 45 minutes chart below, we can see wave (4) of the impulse structure ended at 1627.3. The Index has resumed higher in wave 5 with subdivision of another 5 waves in lesser degree. Up from 1627.3, wave ((i)) ended at 1676.6 and wave ((ii)) pullback ended at 1652. Wave ((iii)) of 5 now remains in progress and shows an extension. Up from 1652, wave (i) of ((iii)) ended at 1691.2 and pullback in wave (ii) of ((iii)) ended at 1676.41.
Near term, while dips remain above 1676.41, expect the Index to continue higher. Possible target of wave ((iii)) is 161.8% Fibonacci extension of wave ((i)) which comes at 1732.04. Afterwards, Index should pullback in wave ((iv)) and then extend higher again in wave ((v)) of 5 before ending cycle from August 26, 2019 low. We don’t like selling the Index and expect short term dips to continue finding support in 3, 7, or 11 swing against 1676.41 pivot low in the first degree and against January 8, 2020 low (1627.3) in second degree.

Russell 2000 ETF (IWM) long.All description on the chart.
Please, don't forget to like and follow.
Thank you.
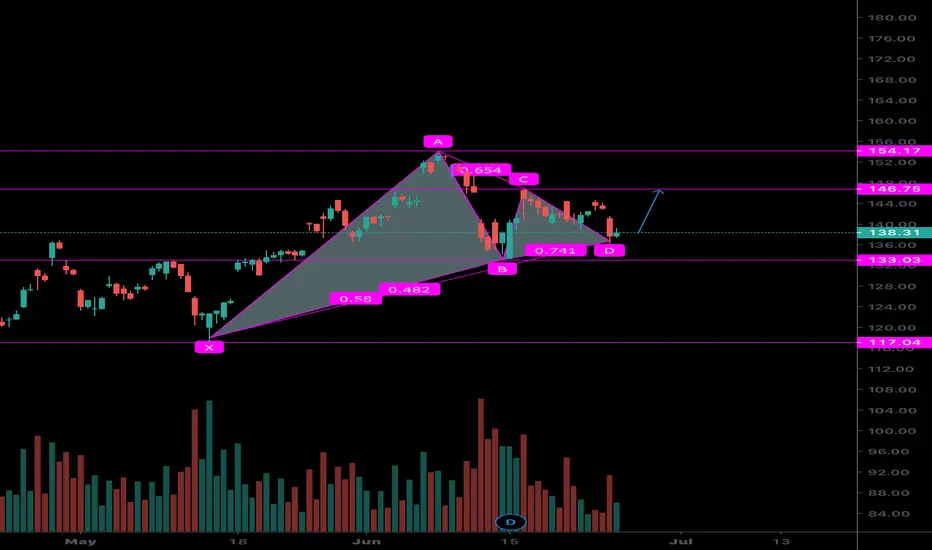
Russell 2000 Price Forecast- All Time Highs?With new all time highs for everyone else, The Russell feels left out. If this beast gets too emotional, and wants to join in, I believe this is how it would look : )
- This is not financial advice. For Artistic purposes only.

E-MINI RUSSELL 2000 INDEX : LONGThe Russell index is a SME-oriented index that mostly addresses the American domestic market.
This index should generally show parallel movements with the Dow Transportation index.
In this respect, we received a good confirmation.
Determine the position size in small amounts.
For this analysis:
STOPLOSS : 1542.5
GOAL : 1743.5
RISK REWARD RATIO : 1/3

$US2000 $Russell2000 Triggered ShortBusted high sloped pitchfork rail. $SPY $VXX $IWM $QQQ $AAPL $MMM


Russell 2000 - The bigger picture...On a daily chart, the Russell is looking great, however, on the weekly chart shown above. The Russell is reaching a resistance on what we can see is a downtrend of lowers highs, and lower lows .
Take profits and protect your gains. This is a very bearish flag.

Value Line indexes Geometric and Arithmetic disparity comparedValue Line indexes Geometric and Arithmetic disparity compared to Russell 3000 (98% of US Total Market Cap)

RUSSELL (RUT) ON THE VERGE OF BREAK (-OUT OR -DOWN)Simmetrical triangle on the verge of coming to the apex.

RTY vs SPX - One of these is not like the other...Similar to our CL vs SPX chart; these two usually move in tandem, but the gap is widening. Is Russell leading, or behind schedule? My guess is the former.
