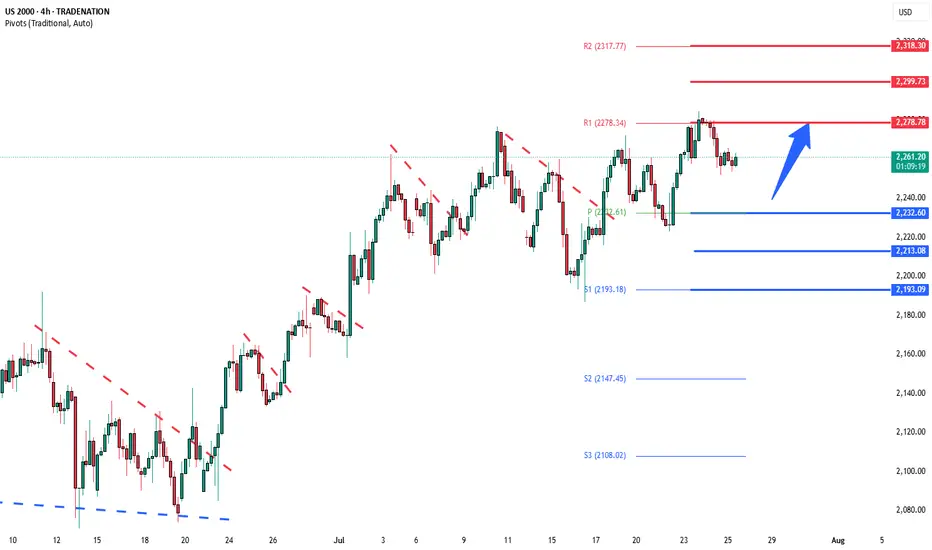
Russell2000 Bullish continuation supported at 2232.60Key Support and Resistance Levels
Resistance Level 1: 2278.80
Resistance Level 2: 2299.70
Resistance Level 3: 2318.30
Support Level 1: 2232.60
Support Level 2: 2213.00
Support Level 3: 2193.00
This communication is for informational purposes only and should not be viewed as any form of recommendation as to a particular course of action or as investment advice. It is not intended as an offer or solicitation for the purchase or sale of any financial instrument or as an official confirmation of any transaction. Opinions, estimates and assumptions expressed herein are made as of the date of this communication and are subject to change without notice. This communication has been prepared based upon information, including market prices, data and other information, believed to be reliable; however, Trade Nation does not warrant its completeness or accuracy. All market prices and market data contained in or attached to this communication are indicative and subject to change without notice.
Russell2000
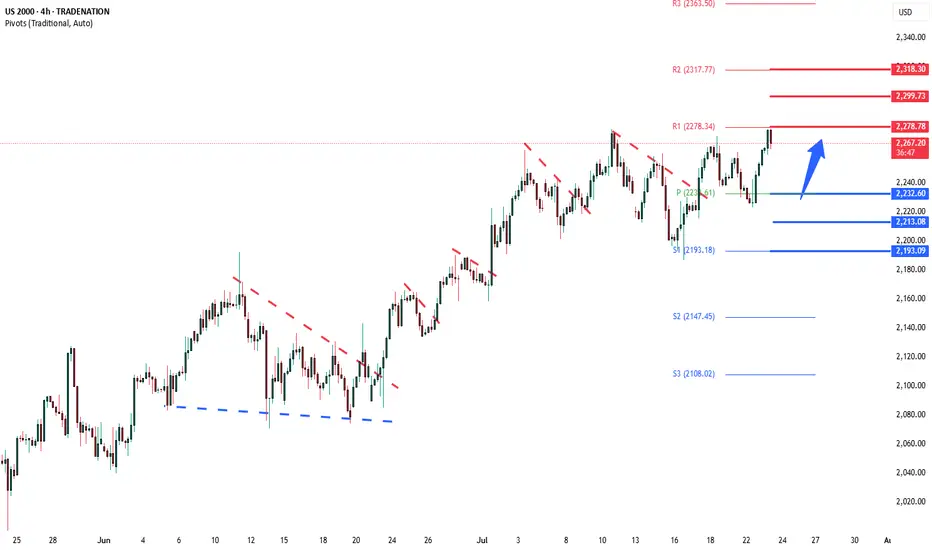
Russell2000 bullish continuation breakoutKey Support and Resistance Levels
Resistance Level 1: 2278.80
Resistance Level 2: 2299.70
Resistance Level 3: 2318.30
Support Level 1: 2232.60
Support Level 2: 2213.00
Support Level 3: 2193.00
This communication is for informational purposes only and should not be viewed as any form of recommendation as to a particular course of action or as investment advice. It is not intended as an offer or solicitation for the purchase or sale of any financial instrument or as an official confirmation of any transaction. Opinions, estimates and assumptions expressed herein are made as of the date of this communication and are subject to change without notice. This communication has been prepared based upon information, including market prices, data and other information, believed to be reliable; however, Trade Nation does not warrant its completeness or accuracy. All market prices and market data contained in or attached to this communication are indicative and subject to change without notice.
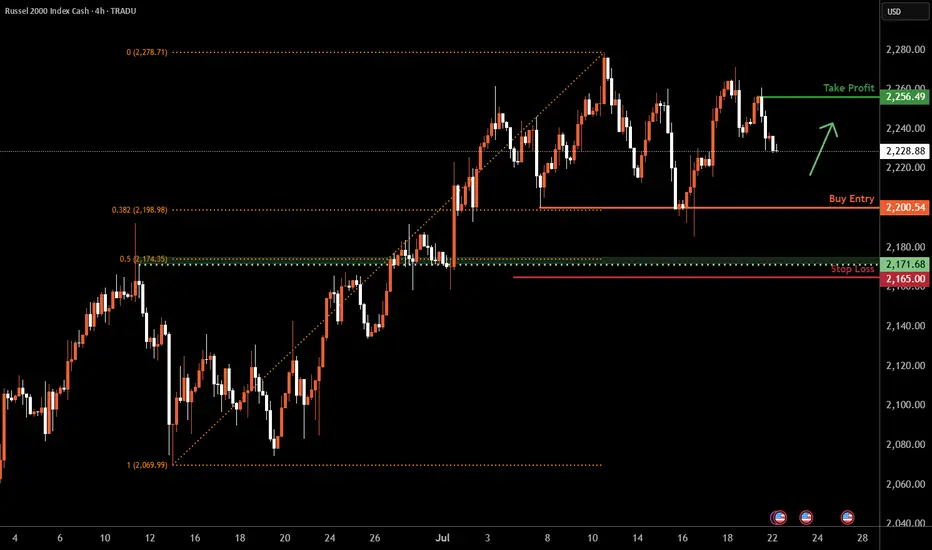
Russell 2000 H4 | Falling toward a multi-swing-low supportThe Russell 2000 (US2000) is falling towards a multi-swing-low support and could potentially bounce off this level to climb higher.
Buy entry is at 2,200.54 which is a multi-swing-low support that aligns with the 38.2% Fibonacci retracement.
Stop loss is at 2,165.00 which is a level that lies underneath an overlap support and the 50% Fibonacci retracement.
Take profit is at 2,256.49 which is a swing-high resistance.
High Risk Investment Warning
Trading Forex/CFDs on margin carries a high level of risk and may not be suitable for all investors. Leverage can work against you.
Stratos Markets Limited (tradu.com ):
CFDs are complex instruments and come with a high risk of losing money rapidly due to leverage. 66% of retail investor accounts lose money when trading CFDs with this provider. You should consider whether you understand how CFDs work and whether you can afford to take the high risk of losing your money.
Stratos Europe Ltd (tradu.com ):
CFDs are complex instruments and come with a high risk of losing money rapidly due to leverage. 66% of retail investor accounts lose money when trading CFDs with this provider. You should consider whether you understand how CFDs work and whether you can afford to take the high risk of losing your money.
Stratos Global LLC (tradu.com ):
Losses can exceed deposits.
Please be advised that the information presented on TradingView is provided to Tradu (‘Company’, ‘we’) by a third-party provider (‘TFA Global Pte Ltd’). Please be reminded that you are solely responsible for the trading decisions on your account. There is a very high degree of risk involved in trading. Any information and/or content is intended entirely for research, educational and informational purposes only and does not constitute investment or consultation advice or investment strategy. The information is not tailored to the investment needs of any specific person and therefore does not involve a consideration of any of the investment objectives, financial situation or needs of any viewer that may receive it. Kindly also note that past performance is not a reliable indicator of future results. Actual results may differ materially from those anticipated in forward-looking or past performance statements. We assume no liability as to the accuracy or completeness of any of the information and/or content provided herein and the Company cannot be held responsible for any omission, mistake nor for any loss or damage including without limitation to any loss of profit which may arise from reliance on any information supplied by TFA Global Pte Ltd.
The speaker(s) is neither an employee, agent nor representative of Tradu and is therefore acting independently. The opinions given are their own, constitute general market commentary, and do not constitute the opinion or advice of Tradu or any form of personal or investment advice. Tradu neither endorses nor guarantees offerings of third-party speakers, nor is Tradu responsible for the content, veracity or opinions of third-party speakers, presenters or participants.
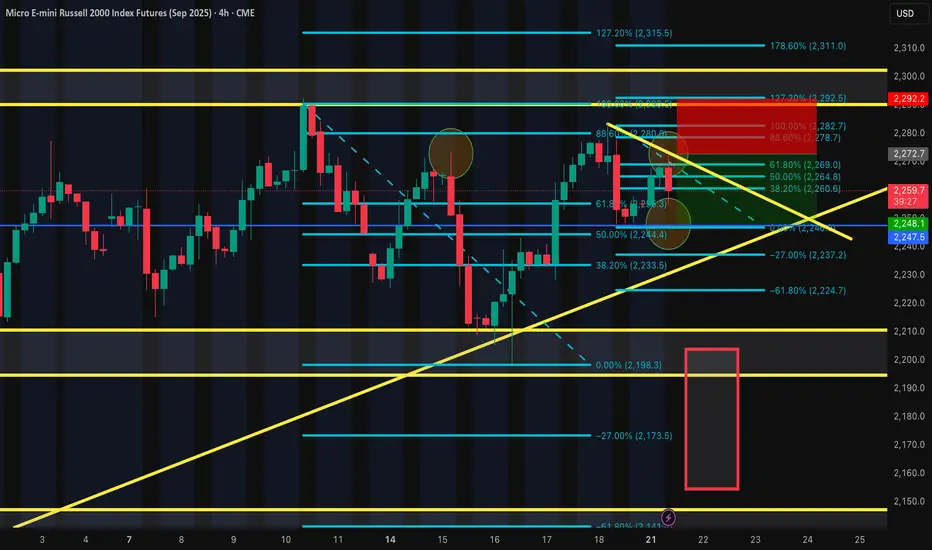
The Russell SELL Trade IdeaWe are currently SHORT on the Russell. I expect the price to hit the 2247 level within the next 24-48 hours. Let me know your thoughts.
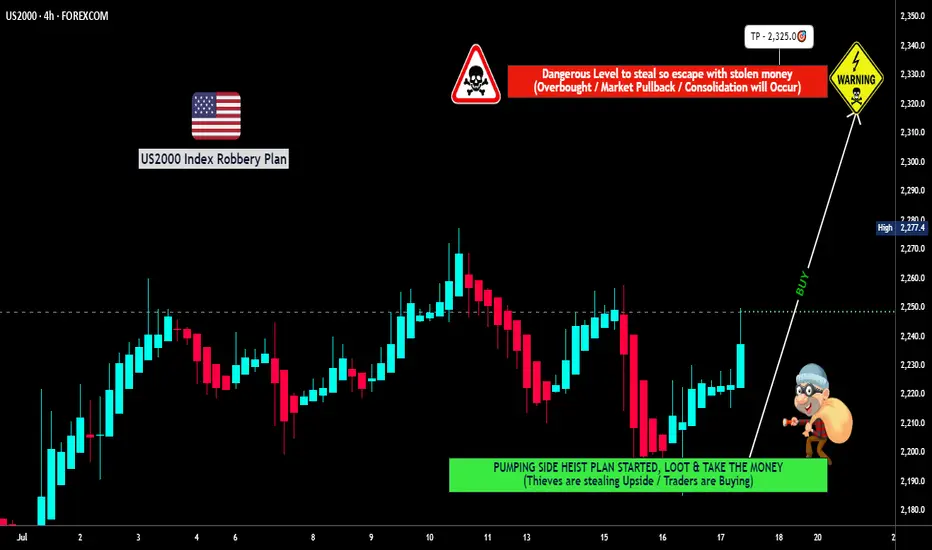
"US2000 THIEF TRADE: SWIPE & ESCAPE BEFORE BEARS!"🔥💰 "RUSSELL 2000 HEIST" – THIEF TRADING STYLE (BULLISH LOOTING IN PROGRESS!) 💰🔥
🚨 ATTENTION, MARKET ROBBERS & MONEY MAKERS! 🚨
(Thief Trading Strategy – High-Reward, Low-Risk Escape Plan!)
🎯 MISSION: US2000 / RUSSELL 2000 INDEX
(Current Market Status: Bullish Heist in Progress!)
🔓 ENTRY POINT: "THE VAULT IS OPEN!"
"SWIPE THE BULLISH LOOT AT ANY PRICE!" 🏦💨
Pro Thief Move: Use Buy Limit Orders (15-30min TF) near recent swing lows/highs for sneaky pullback entries.
Advanced Heist Tactics: Layered DCA entries (multiple limit orders) for maximum stealth & profit.
🛑 STOP-LOSS (ESCAPE ROUTE):
SL @ Nearest Swing Low (4H TF – 2200.0)
Risk Management Tip: Adjust SL based on your loot size (position sizing) & number of orders.
🏴☠️ TARGET: 2325.0 (OR ESCAPE BEFORE THE BEARS CATCH YOU!)
Scalpers Alert! 🚨 Only LONG-side scalp – if you’re rich, go all-in. If not, join the swing heist & use Trailing SL to lock profits!
💥 WHY THIS HEIST WILL WORK:
✔ Bullish Momentum Fueling the Rally
✔ Weak Bears Trapped Near Resistance
✔ Smart Money Accumulating Before Breakout
✔ Institutional Flow & Macro Trends Aligned (Check COT Report & News!)
📰 THIEF’S NEWS ALERT:
🚨 Beware of High-Impact News! (Avoid new trades during volatility.)
🚨 Use Trailing SL to Protect Your Loot!
💖 SUPPORT THE HEIST SQUAD!
👉 SMASH THAT "LIKE" & "BOOST" BUTTON! 👈
(More heists = More profits for all!)
🎭 DISCLAIMER:
This is NOT financial advice – just a Thief Trading Strategy! Trade at your own risk. Market conditions change fast, so stay sharp!
🚀 NEXT HEIST COMING SOON… STAY TUNED, ROBBERS! 🤑
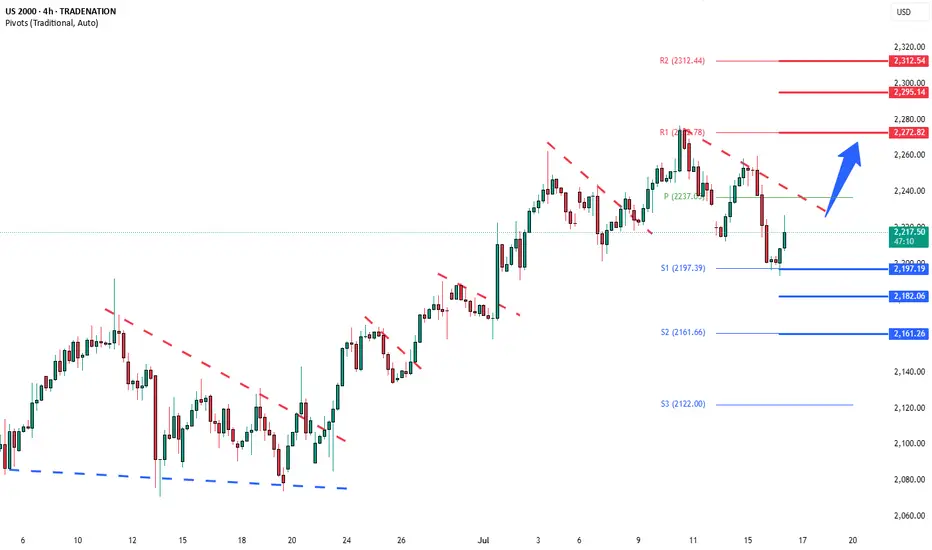
Russell2000 corrective pullback supported at 2197Key Support and Resistance Levels
Resistance Level 1: 2270
Resistance Level 2: 2295
Resistance Level 3: 2313
Support Level 1: 2197
Support Level 2: 2180
Support Level 3: 2160
This communication is for informational purposes only and should not be viewed as any form of recommendation as to a particular course of action or as investment advice. It is not intended as an offer or solicitation for the purchase or sale of any financial instrument or as an official confirmation of any transaction. Opinions, estimates and assumptions expressed herein are made as of the date of this communication and are subject to change without notice. This communication has been prepared based upon information, including market prices, data and other information, believed to be reliable; however, Trade Nation does not warrant its completeness or accuracy. All market prices and market data contained in or attached to this communication are indicative and subject to change without notice.
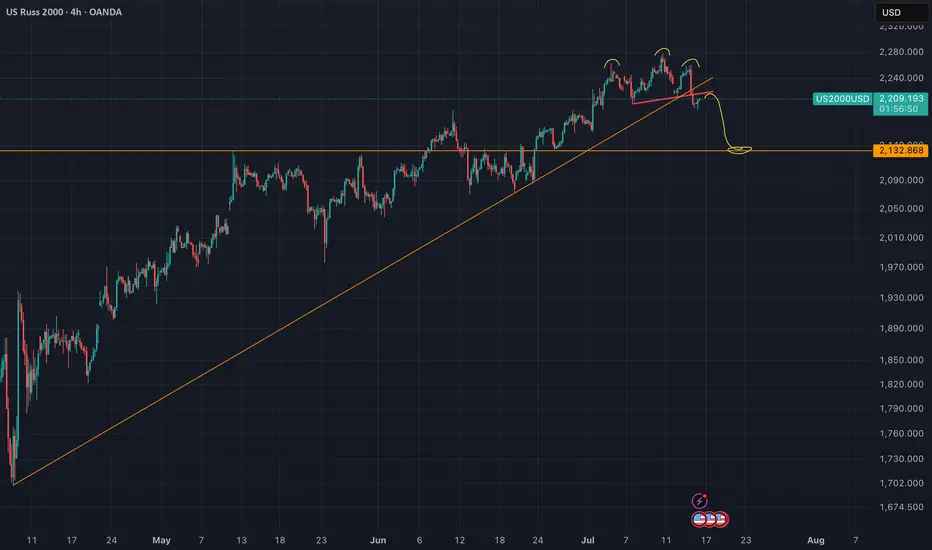
US2000 - Head And Shoulders (Top signal)Reversal in play. The neckline of the H&S got validated yesterday.
Nothing here should be interpreted as financial advise. Always do your own research and decisions.
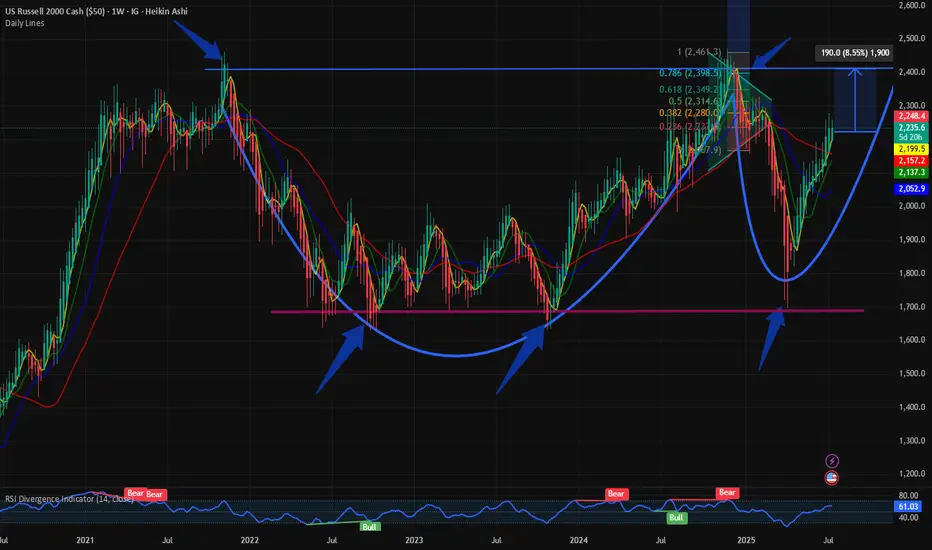
$RUSSEL: Completion of Cup and Handle formation or higher?The small cap index $RUSSEL has had a good past couple of months and has bounced back from its lows. We visited the small cap index on May 1st when we identified the trend reversal. The $RUSSEL was in the recovery mode after the Liberation Day capitulation.
IG:RUSSELL in a bounce back mode. But upside is capped @ 2400 for IG:RUSSELL by RabishankarBiswal — TradingView
This cup and handle pattern is still on hold, and I also predicted that the upside is capped @ 2400. Currently the $RUSSEL is @ 2222.
So how much upside can we expect from here with TVC:DXY making new lows? My assumption is that $RUSSEL will fail to break above 2400, and the handle part will not break out of the reverse neckline. So, the upside in the small caps is capped @ 2400 which seems to be a major resistance indicating a 9% upside from here.
Verdict : $RUSSEL Cup and handle pattern nearing completion. 2400 is the upper resistance. Still some more room to run.
Russell 2000 H4 | Potential bounce off a swing-low support?The Russell 2000 (US2000) is falling towards a swing-low support and could potentially bounce off this level to climb higher.
Buy entry is at 2,210.84 which is a swing-low support that aligns closely with the 38.2% Fibonacci retracement.
Stop loss is at 2,155.00 which is a level that lies underneath an overlap support and the 50% Fibonacci retracement.
Take profit is at 2,276.04 which is a swing-high resistance.
High Risk Investment Warning
Trading Forex/CFDs on margin carries a high level of risk and may not be suitable for all investors. Leverage can work against you.
Stratos Markets Limited (tradu.com ):
CFDs are complex instruments and come with a high risk of losing money rapidly due to leverage. 63% of retail investor accounts lose money when trading CFDs with this provider. You should consider whether you understand how CFDs work and whether you can afford to take the high risk of losing your money.
Stratos Europe Ltd (tradu.com ):
CFDs are complex instruments and come with a high risk of losing money rapidly due to leverage. 63% of retail investor accounts lose money when trading CFDs with this provider. You should consider whether you understand how CFDs work and whether you can afford to take the high risk of losing your money.
Stratos Global LLC (tradu.com ):
Losses can exceed deposits.
Please be advised that the information presented on TradingView is provided to Tradu (‘Company’, ‘we’) by a third-party provider (‘TFA Global Pte Ltd’). Please be reminded that you are solely responsible for the trading decisions on your account. There is a very high degree of risk involved in trading. Any information and/or content is intended entirely for research, educational and informational purposes only and does not constitute investment or consultation advice or investment strategy. The information is not tailored to the investment needs of any specific person and therefore does not involve a consideration of any of the investment objectives, financial situation or needs of any viewer that may receive it. Kindly also note that past performance is not a reliable indicator of future results. Actual results may differ materially from those anticipated in forward-looking or past performance statements. We assume no liability as to the accuracy or completeness of any of the information and/or content provided herein and the Company cannot be held responsible for any omission, mistake nor for any loss or damage including without limitation to any loss of profit which may arise from reliance on any information supplied by TFA Global Pte Ltd.
The speaker(s) is neither an employee, agent nor representative of Tradu and is therefore acting independently. The opinions given are their own, constitute general market commentary, and do not constitute the opinion or advice of Tradu or any form of personal or investment advice. Tradu neither endorses nor guarantees offerings of third-party speakers, nor is Tradu responsible for the content, veracity or opinions of third-party speakers, presenters or participants.

"US2000 Technical Play: Long Entry at Key Support"RUSSELL 2000 BULLISH BREAKOUT STRATEGY
*(High-Probability Swing Trade Setup on RUT/US2000)*
TRADE EXECUTION PLAN
ENTRY STRATEGY
Preferred Entry: Wait for pullback to 2170 support zone (15M/30M charts)
Confirmation Entry: Valid breakout above 2170 resistance (1H closing basis)
Order Placement: Use limit orders near support or stop orders above resistance
RISK PROTOCOLS
Stop Loss Placement: 2130 (swing low on 3H/4H timeframe)
Position Sizing: Maximum 1-3% risk per trade
Key Reminder: Strict risk management is essential for long-term success
PROFIT TARGETS
Primary Objective: 2230 resistance level
Alternative Approach: Trail stop loss if momentum weakens prematurely
Scalping Note: Focus exclusively on long-side opportunities in current market conditions
MARKET ANALYSIS
Technical Factors: Emerging higher low pattern, strengthening momentum
Fundamental Drivers: Supportive environment for small-cap equities
Sentiment Indicators: Retail positioning suggests room for upside
IMPORTANT WARNING
News Event Protocol: Avoid trading during high-impact announcements
Position Management: Adjust stops accordingly during volatile periods
Trading Discipline: No new entries when major news is pending
TRADING PSYCHOLOGY NOTE
This swing trade requires patience and discipline. Wait for proper confirmation signals before execution and maintain strict risk parameters throughout the trade duration.
ENGAGEMENT REQUEST
If you find this analysis valuable, please like and follow for more trade ideas. Share your perspective in the comments section.
(Disclaimer: This content is for educational purposes only. Trading involves substantial risk.)
NEXT MARKET ANALYSIS COMING SOON

Russell 2000 H4 | Falling toward a swing-low supportThe Russell 2000 (US2000) is falling towards a swing-low support and could potentially bounce off this level to climb higher.
Buy entry is at 2,210.84 which is a swing-low support.
Stop loss is at 2,155.00 which is a level that lies underneath an overlap support and the 50% Fibonacci retracement.
Take profit is at 2,278.39 which is a resistance that aligns with the 127.2% Fibonacci extension.
High Risk Investment Warning
Trading Forex/CFDs on margin carries a high level of risk and may not be suitable for all investors. Leverage can work against you.
Stratos Markets Limited (tradu.com ):
CFDs are complex instruments and come with a high risk of losing money rapidly due to leverage. 63% of retail investor accounts lose money when trading CFDs with this provider. You should consider whether you understand how CFDs work and whether you can afford to take the high risk of losing your money.
Stratos Europe Ltd (tradu.com ):
CFDs are complex instruments and come with a high risk of losing money rapidly due to leverage. 63% of retail investor accounts lose money when trading CFDs with this provider. You should consider whether you understand how CFDs work and whether you can afford to take the high risk of losing your money.
Stratos Global LLC (tradu.com ):
Losses can exceed deposits.
Please be advised that the information presented on TradingView is provided to Tradu (‘Company’, ‘we’) by a third-party provider (‘TFA Global Pte Ltd’). Please be reminded that you are solely responsible for the trading decisions on your account. There is a very high degree of risk involved in trading. Any information and/or content is intended entirely for research, educational and informational purposes only and does not constitute investment or consultation advice or investment strategy. The information is not tailored to the investment needs of any specific person and therefore does not involve a consideration of any of the investment objectives, financial situation or needs of any viewer that may receive it. Kindly also note that past performance is not a reliable indicator of future results. Actual results may differ materially from those anticipated in forward-looking or past performance statements. We assume no liability as to the accuracy or completeness of any of the information and/or content provided herein and the Company cannot be held responsible for any omission, mistake nor for any loss or damage including without limitation to any loss of profit which may arise from reliance on any information supplied by TFA Global Pte Ltd.
The speaker(s) is neither an employee, agent nor representative of Tradu and is therefore acting independently. The opinions given are their own, constitute general market commentary, and do not constitute the opinion or advice of Tradu or any form of personal or investment advice. Tradu neither endorses nor guarantees offerings of third-party speakers, nor is Tradu responsible for the content, veracity or opinions of third-party speakers, presenters or participants.

Russell2000 uptrend continuation supported at 2200Key Support and Resistance Levels
Resistance Level 1: 2270
Resistance Level 2: 2295
Resistance Level 3: 2320
Support Level 1: 2200
Support Level 2: 2190
Support Level 3: 2170
This communication is for informational purposes only and should not be viewed as any form of recommendation as to a particular course of action or as investment advice. It is not intended as an offer or solicitation for the purchase or sale of any financial instrument or as an official confirmation of any transaction. Opinions, estimates and assumptions expressed herein are made as of the date of this communication and are subject to change without notice. This communication has been prepared based upon information, including market prices, data and other information, believed to be reliable; however, Trade Nation does not warrant its completeness or accuracy. All market prices and market data contained in or attached to this communication are indicative and subject to change without notice.

$IWM is set for a Blow-Off Top - 34% UpsdieAMEX:IWM is about to have a blow-off top moment!
Catch up mode engaged...
- Breakout of downward trend
- Volume shelf launch
- Rate cuts inbound
- Suppressed for 4 years
PTs: $244/ 259/ 276 (MM)

Russell2000 bullish breakout supported at 2167Key Support and Resistance Levels
Resistance Level 1: 2225
Resistance Level 2: 2240
Resistance Level 3: 2255
Support Level 1: 2167
Support Level 2: 2150
Support Level 3: 2134
This communication is for informational purposes only and should not be viewed as any form of recommendation as to a particular course of action or as investment advice. It is not intended as an offer or solicitation for the purchase or sale of any financial instrument or as an official confirmation of any transaction. Opinions, estimates and assumptions expressed herein are made as of the date of this communication and are subject to change without notice. This communication has been prepared based upon information, including market prices, data and other information, believed to be reliable; however, Trade Nation does not warrant its completeness or accuracy. All market prices and market data contained in or attached to this communication are indicative and subject to change without notice.

Russell 2000 H4 | Falling toward a pullback supportThe Russell 2000 (US2000) is falling towards a pullback support and could potentially bounce off this level to climb higher.
Buy entry is at 2,163.07 which is a pullback support that aligns with the 23.6% Fibonacci retracement.
Stop loss is at 2,130.00 which is a level that lies underneath an overlap support and the 50% Fibonacci retracement.
Take profit is at 2,215.08 which is an overlap resistance.
High Risk Investment Warning
Trading Forex/CFDs on margin carries a high level of risk and may not be suitable for all investors. Leverage can work against you.
Stratos Markets Limited (tradu.com ):
CFDs are complex instruments and come with a high risk of losing money rapidly due to leverage. 63% of retail investor accounts lose money when trading CFDs with this provider. You should consider whether you understand how CFDs work and whether you can afford to take the high risk of losing your money.
Stratos Europe Ltd (tradu.com ):
CFDs are complex instruments and come with a high risk of losing money rapidly due to leverage. 63% of retail investor accounts lose money when trading CFDs with this provider. You should consider whether you understand how CFDs work and whether you can afford to take the high risk of losing your money.
Stratos Global LLC (tradu.com ):
Losses can exceed deposits.
Please be advised that the information presented on TradingView is provided to Tradu (‘Company’, ‘we’) by a third-party provider (‘TFA Global Pte Ltd’). Please be reminded that you are solely responsible for the trading decisions on your account. There is a very high degree of risk involved in trading. Any information and/or content is intended entirely for research, educational and informational purposes only and does not constitute investment or consultation advice or investment strategy. The information is not tailored to the investment needs of any specific person and therefore does not involve a consideration of any of the investment objectives, financial situation or needs of any viewer that may receive it. Kindly also note that past performance is not a reliable indicator of future results. Actual results may differ materially from those anticipated in forward-looking or past performance statements. We assume no liability as to the accuracy or completeness of any of the information and/or content provided herein and the Company cannot be held responsible for any omission, mistake nor for any loss or damage including without limitation to any loss of profit which may arise from reliance on any information supplied by TFA Global Pte Ltd.
The speaker(s) is neither an employee, agent nor representative of Tradu and is therefore acting independently. The opinions given are their own, constitute general market commentary, and do not constitute the opinion or advice of Tradu or any form of personal or investment advice. Tradu neither endorses nor guarantees offerings of third-party speakers, nor is Tradu responsible for the content, veracity or opinions of third-party speakers, presenters or participants.

The Ghost of 1986-1987 Stock Market Overlay onto $IWMThe 1986-1987 stock market advance was 48% as measured by the S&P500 Index SP:SPX from the low in late 1986 which peaked in August 1987 and crashed into October 19th's spectacular 20% decline in one day.
The advance in the Russell 2000 Index from the low in 2023 to the high in 2024 was 51%, topping the 48% gain in the SP:SPX and the meltdown wasn't as spectacular, but it was similar.
There were similar patterns in fears of trade wars, US dollar declines, new tax laws going into effect back then and tax laws sunsetting this time. Those you can go into by reviewing my other charts I have published over the years here.
I stretched the 1987 pattern to fit the low to the high, so it isn't "exactly" the same time day-to-day for this pattern.
I found it interesting because the chart of AMEX:IWM all by itself had the same "look" to me as the 1987 bull market and crash so I decided to put it together for you all here to see.
I would expect a choppy market from here on as people adjust to the new uncertainties. Sellers of this decline will be shy to reinvest anytime soon and buyers are likely afraid to step up and get aggressive with so much uncertainty.
Sentiment as measured by AAII shows an extremely fearful and reluctant investor class, which is typical to see at major market bottoms.
Wishing everyone peace and prosperity!
Tim West
11:17AM EST April 24, 2025

Mr. Rusell (Small Cap index) & Altseason go hand in hand. That's right it does.
Why?
Because small businesses employ nearly half of the workforce of the United States.
So when financial conditions exist for confidence to grow at this level of the economy expressed via hiring and expansion of said businesses the ripple effects are huge.
Which can be seen during Altcoin boom's (banana zones)
This cycle especially as one whole Bitcoin is out of reach for the common man. When Retail hot money does return to crypto expect small cap low numerical valued coins to really start outperforming BTC

Russell2000 Key Trading LevelsKey Support and Resistance Levels
Resistance Level 1: 2180
Resistance Level 2: 2195
Resistance Level 3: 2220
Support Level 1: 2110
Support Level 2: 2095
Support Level 3: 2080
This communication is for informational purposes only and should not be viewed as any form of recommendation as to a particular course of action or as investment advice. It is not intended as an offer or solicitation for the purchase or sale of any financial instrument or as an official confirmation of any transaction. Opinions, estimates and assumptions expressed herein are made as of the date of this communication and are subject to change without notice. This communication has been prepared based upon information, including market prices, data and other information, believed to be reliable; however, Trade Nation does not warrant its completeness or accuracy. All market prices and market data contained in or attached to this communication are indicative and subject to change without notice.

Russell2000 key trading levelsKey Support and Resistance Levels
Resistance Level 1: 2170
Resistance Level 2: 2195
Resistance Level 3: 2242
Support Level 1: 2074
Support Level 2: 2050
Support Level 3: 2000
This communication is for informational purposes only and should not be viewed as any form of recommendation as to a particular course of action or as investment advice. It is not intended as an offer or solicitation for the purchase or sale of any financial instrument or as an official confirmation of any transaction. Opinions, estimates and assumptions expressed herein are made as of the date of this communication and are subject to change without notice. This communication has been prepared based upon information, including market prices, data and other information, believed to be reliable; however, Trade Nation does not warrant its completeness or accuracy. All market prices and market data contained in or attached to this communication are indicative and subject to change without notice.

$SSP Low volume on Wave 2, momentum risingFirstly, on the line chart is possible to watch the possible targets - blue lines - which one of it is almost as the same level as 2,618.
Fibonacci measured from the breakout to monthly resistance.
res M = monthly resistance
During the Wave 2, the two candles from last two days showed low volume as usual to happen during formation of W2, and it is possible to see that price at the breakout and after it was above average which can be read as high interest from buyers.
Confirming the volume, the EFI even though is decreasing still show strength,OBV follow the price trend but looks like buyers are entering again.
When it comes to momentum is possible to see that RSI did not crossed the equilibrium even after two bearish days, as ROC being a leading indicator which already changed direction . ADX is showing some strength for the trend direction confirmed by as DMI+ is still above DMI-
DTC = 1,36

Russell 2000 H1 | Pullback resistance at 61.8% Fibo retracementThe Russell 2000 (US2000) is rising towards a pullback resistance and could potentially reverse off this level to drop lower.
Sell entry is at 2,112.73 which is a pullback resistance that aligns closely with the 38.2% and 61.8% Fibonacci retracements.
Stop loss is at 2,135.00 which is a level that sits above the 50% and 78.6% Fibonacci retracements and a pullback resistance.
Take profit is at 2,071.60 which is an overlap support that aligns with the 78.6% Fibonacci retracement.
High Risk Investment Warning
Trading Forex/CFDs on margin carries a high level of risk and may not be suitable for all investors. Leverage can work against you.
Stratos Markets Limited (tradu.com ):
CFDs are complex instruments and come with a high risk of losing money rapidly due to leverage. 63% of retail investor accounts lose money when trading CFDs with this provider. You should consider whether you understand how CFDs work and whether you can afford to take the high risk of losing your money.
Stratos Europe Ltd (tradu.com ):
CFDs are complex instruments and come with a high risk of losing money rapidly due to leverage. 63% of retail investor accounts lose money when trading CFDs with this provider. You should consider whether you understand how CFDs work and whether you can afford to take the high risk of losing your money.
Stratos Global LLC (tradu.com ):
Losses can exceed deposits.
Please be advised that the information presented on TradingView is provided to Tradu (‘Company’, ‘we’) by a third-party provider (‘TFA Global Pte Ltd’). Please be reminded that you are solely responsible for the trading decisions on your account. There is a very high degree of risk involved in trading. Any information and/or content is intended entirely for research, educational and informational purposes only and does not constitute investment or consultation advice or investment strategy. The information is not tailored to the investment needs of any specific person and therefore does not involve a consideration of any of the investment objectives, financial situation or needs of any viewer that may receive it. Kindly also note that past performance is not a reliable indicator of future results. Actual results may differ materially from those anticipated in forward-looking or past performance statements. We assume no liability as to the accuracy or completeness of any of the information and/or content provided herein and the Company cannot be held responsible for any omission, mistake nor for any loss or damage including without limitation to any loss of profit which may arise from reliance on any information supplied by TFA Global Pte Ltd.
The speaker(s) is neither an employee, agent nor representative of Tradu and is therefore acting independently. The opinions given are their own, constitute general market commentary, and do not constitute the opinion or advice of Tradu or any form of personal or investment advice. Tradu neither endorses nor guarantees offerings of third-party speakers, nor is Tradu responsible for the content, veracity or opinions of third-party speakers, presenters or participants.

Russell INTRADAY Key Trading levelsKey Support and Resistance Levels
Resistance Level 1: 2196
Resistance Level 2: 2230
Resistance Level 3: 2260
Support Level 1: 2070
Support Level 2: 2040
Support Level 3: 2010
This communication is for informational purposes only and should not be viewed as any form of recommendation as to a particular course of action or as investment advice. It is not intended as an offer or solicitation for the purchase or sale of any financial instrument or as an official confirmation of any transaction. Opinions, estimates and assumptions expressed herein are made as of the date of this communication and are subject to change without notice. This communication has been prepared based upon information, including market prices, data and other information, believed to be reliable; however, Trade Nation does not warrant its completeness or accuracy. All market prices and market data contained in or attached to this communication are indicative and subject to change without notice.

LIGHTBRIDGE BREAKING out from a DOUBLE BOTTOMDYOR on the fundamentals.
This idea share is solely based on the chart.
Which exhibits a beautiful double bottom breakout.
