russell 2000 almost finished sub 5th wave of C wave shortrussell 2000 rebounded from june 17 low ,developing a ABC correction. And very close to finished the 5th sub-wave of C. It's time to short it when the ending diagonal breakdown.
Russell2000

The bias is still for higher levels on US Russ 2000US Russ 2000 - Intraday - We look to Buy at 1870 (stop at 1845)
Although the bulls are in control, the stalling positive momentum indicates a turnaround is possible. We are trading at overbought extremes. A lower correction is expected. The bias is still for higher levels and we look for any dips to be limited. Preferred trade is to buy on dips.
Our profit targets will be 1940 and 2020
Resistance: 1950 / 2020 / 2140
Support: 1890 / 1830 / 1760
Risk Disclaimer
The trade ideas beyond this page are for informational purposes only and do not constitute investment advice or a solicitation to trade. This information is provided by Signal Centre, a third-party unaffiliated with OANDA, and is intended for general circulation only. OANDA does not guarantee the accuracy of this information and assumes no responsibilities for the information provided by the third party. The information does not take into account the specific investment objectives, financial situation, or particular needs of any particular person. You should take into account your specific investment objectives, financial situation, and particular needs before making a commitment to trade, including seeking advice from an independent financial adviser regarding the suitability of the investment, under a separate engagement, as you deem fit.
You accept that you assume all risks in independently viewing the contents and selecting a chosen strategy.
Where the research is distributed in Singapore to a person who is not an Accredited Investor, Expert Investor or an Institutional Investor, Oanda Asia Pacific Pte Ltd (“OAP“) accepts legal responsibility for the contents of the report to such persons only to the extent required by law. Singapore customers should contact OAP at 6579 8289 for matters arising from, or in connection with, the information/research distributed.'

RUSSEL2000 US2000 Supply And Demand AnalysisSee picture for analysis.
I like looking for shorts with price sitting inside supply + resistance + breakout retest + reacting off of 200MA
let me know your thoughts!

Russell 2000: historical drawdowns point to more downside riskThe Russell 2000 's drawdown from its peak has been important (-26%), but not as severe as those seen during the dot-com bubble in 2002, the 2008 financial crisis, and Covid-19 at the start of 2020, when the US small-cap index plummeted by more than 40%.
To reverse the current downtrend of the Russell 2000 , the underlying causes must also be reversed, which are primarily rising inflation and the need to raise interest rates.
US ECONOMY: MACRO OVERVIEW
Inflation is now widespread and is not solely due to increases in energy prices, such as oil and natural gas . The United States still has a very tight labour market that requires a rebalancing of supply and demand, to avoid further wage pressures. There are currently nearly two job openings for every unemployed American ( FRED:JTSJOL / FRED:UNEMPLOY ) and the labor-force participation rate has not recovered to pre-Covid levels. The result is a strong pressure on salary growth , which is currently at 11% year-on-year.
The combination of higher energy prices and wage pressures raises labour input costs for US firms. Those who are unable to pass on higher costs to their customers will see their profit margins dwindle dangerously. In addition, since the Fed is firmly committed to raising interest rates , higher borrowing costs represent an additional drag on the growth outlook of small-cap firms.
RUSSELL 2000 index: outlook
The market believes that a recession will cause the Federal Reserve to slow its rate hikes or even reverse its policy stance. However, the Fed's focus remains solely on inflation, as the labour market remains close to full employment. To rebalance the labour market, the Fed will continue to raise interest rates aggressively.
The short/medium term outlook on the Russell 2000 index remains bearish until the Fed signals a change, which is unlikely unless there is a major recession.
A 40% drop from the peak would be a good entry point for opportunistic buyers to step in, indicating a wide bullish positioning clean-up. Such a level of drawdown corresponds to a Russell 2000 index level of 1,450.

Nasdaq a leading indicator of Dow Jones, S&P and RussellHow to use related markets to complement each other? Definitely you can apply this technique to other related markets.
In this tutorial, I am seeing Nasdaq as a leading indicator for the rest may likely to follow.
i) Nasdaq bear trend was nicely formed, but not yet for the Dow Jones, S&P and Russell.
ii) Nasdaq in the short-term has also a confirmation for a rebound, and I believe the rest of the indices likely to follow subsequently.
Discussion:
• Drawing primary and secondary trendline
• Nasdaq has broken above, the rest should catch-up, why?
Disclaimer:
• What presented here is not a recommendation, please consult your licensed broker.
• Our mission is to create lateral thinking skills for every investor and trader, knowing when to take a calculated risk with market uncertainty and a bolder risk when opportunity arises.
Feel free to leave any comments below, I love to exchange ideas with you.

Joe Gun2Head Trade - Short term bottom on Russell2000?Trade Idea: Selling EURJPY
Reasoning: EURJPY to continue lower? Broken trend and EUR under pressure
Entry Level: 1752
Take Profit Level: 1794
Stop Loss: 1741.5
Risk/Reward: 4.15:1
Disclaimer – Signal Centre. Please be reminded – you alone are responsible for your trading – both gains and losses. There is a very high degree of risk involved in trading. The technical analysis , like all indicators, strategies, columns, articles and other features accessible on/though this site is for informational purposes only and should not be construed as investment advice by you. Your use of the technical analysis , as would also your use of all mentioned indicators, strategies, columns, articles and all other features, is entirely at your own risk and it is your sole responsibility to evaluate the accuracy, completeness and usefulness (including suitability) of the information. You should assess the risk of any trade with your financial adviser and make your own independent decision(s) regarding any tradable products which may be the subject matter of the technical analysis or any of the said indicators, strategies, columns, articles and all other features.

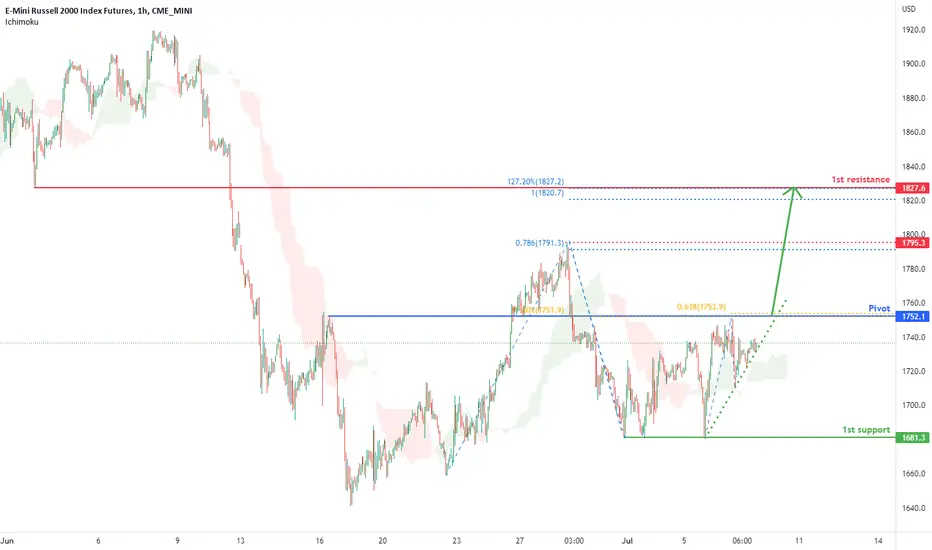
Russell 2000 Index Futures (RTY1!),H1 Potential for Bullish RiseType : Bullish Rise
Resistance : 1827.6
Pivot: 1752.1
Support : 1681.3
Preferred Case: On the H4, with price moving above the ichimoku cloud and along the ascending trendline, we have a bullish bias that price will rise to the pivot at 1752.1 in line with the overlap resistance, 61.8% fibonacci projection and 61.8% fibonacci retracement . Once we have upside confirmation that price has broken past pivot , we would expect bullish momentum to carry price to the intermediate resistance at 1795.3 in line with swing high resistance and 78.6% fibonacci projection. Should price break intermediate resistance, we would have a bullish bias that price would rise to the 1st resistance at 1827.6 where the pullback resistance, 100% fibonacci projection and 127.2% fibonacci extension are.
Alternative scenario: Alternatively, price may drop to the 1st support level at 1681.3 in line with the swing low support.
Fundamentals: Equities continue to experience a volatile summer trading season as Russell 2000 futures continue to trend lower, giving us a bearish bias on Russell 2000.
RUSSELL 2000 respecting FIB levels; ABC may reach 1500 vol zone.The smallcaps Russell 2000 futures RTY1! (also the IWM etf), a leading market indicator like the transports, may complete an A=C correction ending in the volume profile zone near 1500. (IWM seems to be consolidating in tranches of 200…ex…230, 210, 190, now @ 170 & maybe 150 around 4Q2022.) This will complete the final wave 5 of C-wave.
As you can see in this weekly chart, Russell 2000 respects impt FIB levels. 2100 zone is Fib 0.236, 1900 is Fib 0.383, the current 1700 zone is Fib 0.50 & the projected 1500 bottom zone will be Fib 0.618, the most likely zone for a reversal.
THE BULLISH CASE: if Russell 2000 holds the 1700 zone, the bounce will be very quick due to the 2 LOW VOLUME zones. The target will be 2100 with some consolidation near the 1900 zone.
Not trading advice

Cosmos (ATOM) Death or LifeMany cryptos are found in crucial points:
1) BTC is in the 20k zone where we find solid support from the all-time high of 2017 2) ETH at 1k
3) Stocks Market (US500 & Nasdaq 100) on the one week average of 200 and on another solid support.
Returning to some other interesting alcoins we find together with Solana at sale prices
ATOM which is at $ 8 which finds 3 fundamental graphical factors
1) Support of its first point of maximum (green rectangle)
2) The Fibonacci extension at the price of $ 5 which has already been touched and now seems to be consolidating
3) Confirmation of the consolidation phase with a very visible bullish divergence with RSI rising and price falling.
Obviously we are in a bear market and you have to be careful to enter a LONG trade, but it could be an interesting point to accumulate and make a first purchase.
And what do you think?
If you liked the analysis, leave a Like and comment.
For more information contact us privately.
LPI.sa, Grow with Us.

IWMQuestion is do we have an overthrow at play? If yes the IWM needs to get back into my channel and not reject here off the bottom channel TL.
A rejection would almost certainly equal $138 and invalidate the 5 wave intermediate structure.

US2000 Daily Outlook | June 30Holla,
My love for this pair is yet to be measured. It moves at the same time with NAS100, US30, Ger30, US500, but there is something about it that hit me so hard.
You will find out during my live trading session today
See you at 8:45AM EST (mon-fri)
Kings

Russell 2000 Futures Next Leg Down -10%Russell 2k $RTY1! broke below the 200 EMA on weekly and failed to regain 1800 as support.
As the canary in the coal mine, the Russell 2000 comprises of the 2000 smallest stocks of the Russell 3000 (broad capitalization-weighted stock market index that seeks to be a benchmark of the entire U.S stock market) and provides a solid bellwether for forward facing trends.
Next move is a 10% markdown from 1700 to 1550. From there we will likely see a failure to regain 1600. With Q2 earnings coming and early signs of margin compression in the face of rampant inflation ($NKE earnings revealing some weakness), expecting to see 20 EMA crash below the 200 EMA with the 50 EMA following closely behind.
On balance volume reflecting a downtrend that really gained momentum in late March / early April with no sign of reversing in the near-term.

Small Caps Russell 2000 Looks Attractive: Elliott WavesHello traders and investors, today we will talk about small caps Russell 2000, in which from Elliott wave perspective, we see a completed 7-swing complex correction from the highs.
Russell 2000 topped and completed its 5th wave of a five-wave bullish impulse already back in November 2021. Since then we can see slow, choppy and overlapped wave structure that we see it as a correction within uptrend. It's ideally a complex 7-swing A-B-C-X-A-B-C, called also a double three W-X-Y corrective pattern.
A Double three is a sideways combination of two corrective patterns. It's a complex Elliott wave that is subdivided into three minor waves W, X and Y. Its internal structure is (3, 3, 3). In effect, the number three relates to corrective waves, therefore the structure (3, 3, 3) indicates that the WXY wave pattern is composed of three distinctive corrective waves.
• A combination of two corrective structures labelled as WXY
• Wave W and wave Y subdivision can be zigzag , flat, double three of smaller degree, or triple three of smaller degree
• Wave X can be any corrective structure
Well, if we are on the right path and if Russell manages to recover back above 1920 region and resistance line of a corrective channel in current risk-on sentiment, then we can easily confirm support in place and bulls back in the game.
All the best!
If you like what we do, then please like and share our idea.
Disclosure: Please be informed that information we provide is NOT a trading recommendation or investment advice. All of our work is for educational purposes only.

US2000 has more room to fall !!RUSS2000
Intraday
We look to Sell at 1699 (stop at 1714)
We look for a temporary move higher. Risk/Reward would be poor to call a sell from current levels. The bias is still for lower levels and we look for any gains to be limited. Previous resistance located at 1700. Expect trading to remain mixed and volatile.
Our profit targets will be 1645 and 1605
Resistance: 1700 / 1750 / 1945
Support: 1640 / 1470 / 1200
Please be advised that the information presented on TradingView is provided to Vantage (‘Vantage Global Limited’, ‘we’) by a third-party provider (‘Signal Centre’). Please be reminded that you are solely responsible for the trading decisions on your account. There is a very high degree of risk involved in trading. Any information and/or content is intended entirely for research, educational and informational purposes only and does not constitute investment or consultation advice or investment strategy. The information is not tailored to the investment needs of any specific person and therefore does not involve a consideration of any of the investment objectives, financial situation or needs of any viewer that may receive it. Kindly also note that past performance is not a reliable indicator of future results. Actual results may differ materially from those anticipated in forward-looking or past performance statements. We assume no liability as to the accuracy or completeness of any of the information and/or content provided herein and the Company cannot be held responsible for any omission, mistake nor for any loss or damage including without limitation to any loss of profit which may arise from reliance on any information supplied by Signal Centre.

Russell ready to rally✔️Gap has been filled from November 2020.
✔️Bullish divergence on multiple time frames (4H, daily, and weekly)
✔️Put/Call ratio over 1.2
Looking to run to $178.

Russell 2000 Bear Trend
Well.
1) Macro bullish symmetrical triangle fakeout leading to top signal.
2) Low volume on bullish break, High volume on reversal confirming fakeout.
3) Omicron Variant market reaction =~= Covid-19 market reaction
See SPY fakeout before March 2020 Covid-19 crash. (right)
Lastly, see bearish divergence between index and % of stocks above 200 ma (orange).

$BABA china fights to boost economic growth 👁🗨*This is not financial advice, so trade at your own risks*
*My team digs deep and finds stocks that are expected to perform well based off multiple confluences*
*Experienced traders understand the uphill battle in timing the market, so instead my team focuses mainly on risk management*
Today my team purchased shares of Chinese online and mobile commerce company Alibaba $BABA at $88 per share. Our take profit is $118, which is a 34% increase from current levels.
The Chinese economy is desperately in need of a boost. A cut on lending rates is expected to be announced tomorrow. This will boost credit demand and take some weight off of the economic slowdown due to COVID-19 interference.
Good luck to all!
Our Entry: $88
Take Profit: $118
If you want to see more, please like and follow us @SimplyShowMeTheMoney


6/1/22 IWMiShares Russell 2000 ETF ( AMEX:IWM )
Sector: Miscellaneous (Investment Trusts.Mutual Funds)
Market Capitalization: $$--
Current Price: $184.26
Breakout price: $187.85
Buy Zone (Top/Bottom Range): $183.95-$168.15
Price Target: $189.60-$204.00 (1st), $249.20-$278.80 (2nd)
Estimated Duration to Target: 172-180d, 412-422d
Contract of Interest: $IWM 12/16/22 200c, $IWM 6/16/23 210c
Trade price as of publish date: $7.86/contract, $9.41/contract


Daily US Volatility Forecast 23 May 22 SPY,SPX, QQQ, NDX, IWMSPX/ES/SPY 25 May 2022
The current expected volatility movement for today, with around 85% chance, is that is going be below 1.85%
In this case the channel for this asset is going to be:
TOP ~4025
BOT ~3875
For SPY, you can take the current opening price of the asset and to make the top/bot you should add or rest 7.2 points
Lets imagine the price will open on 394
TOP 394 + 7.2
BOT 394 - 7.2
For today, in terms of fundamental news that can affect this asset price, we have :
FOMC meeting
Lastly, we can see that the point of concentration of the volume is around 3950
Having said that I believe that you can either short once the price arrives around the top part of the channel and rebounce.
Or you can go long once the price arrives around the bot part of the channel and rebounce.
In that case you can use the POC from volume as a TP point and below the top/bottom line the SL
---------------------------------------------------------------------------------------------------------------------
NDX/NQ/QQQ 25 May 2022
The current expected volatility movement for today, with around 85% chance, is that is going be below 2.2%
In this case the channel for this asset is going to be:
TOP ~12070
BOT ~11550
For QQQ, you can take the current opening price of the asset and to make the top/bot you should add or rest 6.7 points
Lets imagine the price will open on 288
TOP 288 + 6.7
BOT 288 - 6.7
For today, in terms of fundamental news that can affect this asset price, we have :
FOMC meeting
Lastly, we can see that the point of concentration of the volume is around 11800
Having said that I believe that you can either short once the price arrives around the top part of the channel and rebounce.
Or you can go long once the price arrives around the bot part of the channel and rebounce.
In that case you can use the POC from volume as a TP point and below the top/bottom line the SL
---------------------------------------------------------------------------------------------------------------------
Russel 2000 25 May 2022
The current expected volatility movement for today, with around 80% chance, is that is going be below 2.22%
In this case the channel for this asset is going to be:
TOP ~180
BOT ~171
For today, in terms of fundamental news that can affect this asset price, we have :
FOMC meeting
Having said that I believe that you can either short once the price arrives around the top part of the channel and rebounce.
Or you can go long once the price arrives around the bot part of the channel and rebounce.
In that case you can use the POC from volume as a TP point and below the top/bottom line the SL
---------------------------------------------------------------------------------------------------------------------

US Market Sentiment - Risk ModelThe Ukraine war, ongoing lockdowns in China and associated disruption of global supply chains as well as upcoming inflation are key reasons for the high risk in the current market.
Swing-Traders should act with highest caution and be mostly in cash for quite some time now.
All technical indicators in our risk model are showing high risk, the overall risk rating is very high.
At one point, we will reach the bottom of this significant market correction. It is worthwhile looking at some of the contrarian market indicators:
- bulls vs bears: the current market sentiment is very bearish, with the bears at 43% and the bulls at 28%. We have seen the biggest opportunities in markets which have been characterized like that.
- Margin debt turned negative. We have seen that for the last time in 2020 during the Covid-correction.
Swing-Traders should never trade using these contrarian indicator only but it is worthwhile continuing to look for stock setups and low risk entry points. Either start with paper trading or open a few very small pilot trades. Once you see soe traction in your open trades, you see the risk model improving again and you see the number of stock setups increasing - then it is time to increase risk and exposure.
Until that happens, risk needs to be managed very tightly, stay disciplined!
Our updated watchlist shows only a very few stocks which could be tradable at the moment:
www.tradingview.com
All stocks on our watchlist meet the criteria of Minervini's Trend Template.

Recession? Then Why is the RTY Outperforming?Usually a slowing in the economy hurts the growth oriented RTY the most. Instead, it is outperforming.
