Elliott Wave Analysis: Russell-Small Caps May Face More WeaknessHello traders and investors!
Today we will talk about small caps - Russell 2000 Index in which we see nice and clean bearish setup, which means that Russell may face even more weakness in current risk-off sentiment.
From Elliott wave perspective Russell can be trading in bigger, higher degree A-B-C corrective decline, where wave C is still missing. We can see five waves of decline into first leg A, followed by a three-wave corrective rally in wave B, so wave C can be now in play.
From technical point of view, Russell made an impulsive drop from the highs and retraced perfectly back to the former wave 4 resistance area, from where we can already see sharp sell-off that can take us much lower, especially if breaks channel support line.
Well, seems like bears are still in control and we should expect more downside pressure in upcoming days/weeks, maybe even down to 1500 area, but firstly we want to see broken 1900 bearish confirmation level.
Trade well!
If you like what we do, then please like and share our idea.
Disclosure: Please be informed that information we provide is NOT a trading recommendation or investment advice. All of our work is for educational purposes only.
Russell2000

Russel Potential pullbackRussel is currently stuck in a Trading Range, but also experienced a lot of buying pressure in the first half of the NY trading session. Possibility for a short stop hunt before reversing back down.

Long Signal MESM22Buy Signal
Entry - 4458.50
TP - 4654.00
SL - 4388.00
For Daily Support/Resistance levels click here!
www.cannontrading.com
**Trading commodity futures and options involves substantial risk of loss.
The recommendations contained in this letter is of opinion only and
does not guarantee any profits. These are risky markets and only
risk capital should be used. Past performance is not indicative of future results**
Visit www.cannontrading.com to learn more about
the risk associated with trading futures.

Small-cap attack from the short sideLike other stock indices, the Russell 2000 spent most of the first quarter of this year under pressure and then recovered somewhat in March.
With the DMI having bear crossed today, we are taking an aggressive stance and shorting the index at around 2047. We'll record the trade below as soon as it's entered.

☑️RUSSEL 2000 (US2000): SELL➡️ Markets have been tumbling back and forth over the past couple of weeks amid geopolitical uncertainty, yield curve inversions and talk of a recession. And now we may have received a real bearish reversal signal in the major indices, especially the Russell 2000 Small Cap Index, which was already lagging behind the broader market.
Judging by the dynamics of Russell and a couple of other major indexes, there are indeed reasons for pessimism. The price is in a clear balance of 1878.80 - 2093 , which is most likely formed by sellers in order to push the price further down. The target for selling now most likely is the lower limit of this balance at 1878.80 (first of all) and further market participants will push the price to 1750.62 (second of all).
The mood for sales is very confident. The price area 2036.95 - 2093 will now contain growth and indicate the priority of sales. If the price goes higher, then the sale is called into question.
🔥 S&P500 & US30 Forecast Results 🔥
☑️S&P500: buy priority 👉 +124 points ✅:
☑️US30: stick to the short 👉 +305 points ✅:
➖➖➖➖➖➖➖
👍 Thanks for your comments and likes 👍
👇🔥 LINKS TO PREVIOUS IDEAS AND FORECASTS 🔥👇

Nasdaq, S&P500, Dow Jones, and Russell 2000 Forecast..!2022 started badly, but gives investors a generous opportunity to take some chips off the table..!
The major difference between a Bullish rally and a relief rally is Volume..!
In the past 14 years, I have read 100-150 K pages of books and articles about financial markets, never read a sentence that indicates a bullish rally with lower than average volume is sustainable..!
SPY:
QQQ:
TSLA:
The similarity between 2022,2008, and 2000 becomes more obvious each day..!
Forecast:
The most probable situation is testing green lines once again in the coming weeks..!
Best,
Dr. Moshkelgosha M.D
DISCLAIMER
I’m not a certified financial planner/advisor, a certified financial analyst, an economist, a CPA, an accountant, or a lawyer. I’m not a finance professional through formal education. The contents on this site are for informational purposes only and do not constitute financial, accounting, or legal advice. I can’t promise that the information shared on my posts is appropriate for you or anyone else. By using this site, you agree to hold me harmless from any ramifications, financial or otherwise, that occur to you as a result of acting on information found on this site.

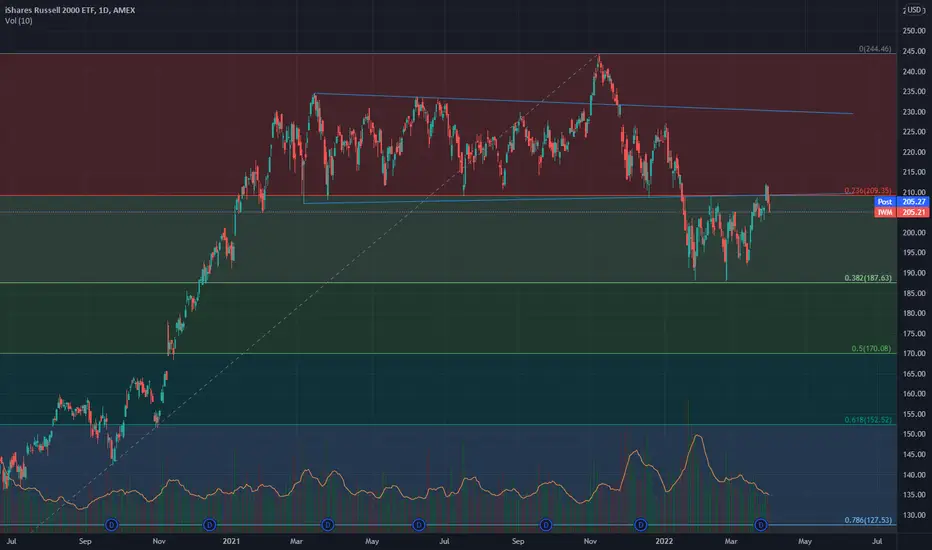
Perfect Retracement for Small Cap Index The Russell 2000 index $IWM retraced and bounced perfectly off the 38% fibonacci level. Actually it bounced twice, which created a double bottom at the 38% retracement level. This strong level of support suggests the bottom may be in and small caps may start to lead the market up again.
Russell2000: H&SThe main figure's target, the monthly rectangle, was 80% completed.
Now there seems to be a sufficient Bullish Reversal Pattern, completed yesterday, a Head and Shoulders with final target at 2300.

Small Caps look Very BullishThe SPY and QQQ look like they need a rest. However, the RTY looks ready for bullish continuation.

RUT Russell 2000 Support and ResistanceRUT Russell 2000 bounced from the strong support of $1940 and is heading to the $2180 resistance.
I also think we might see the end of the war soon.
Russia says the first phase of its “military operation” in Ukraine is mostly complete.
Looking forward to read your opinion about it.

US2000 Russell 2000 Trade ReviewSee Picture for full Top-Down Analysis:
Higher Timeframe:
-Price high on 4hr sideways range so selling is a higher probability
-Buy Low with confirmation on lower-frame confirmation and sell high with confirmation on the lower timeframe.
Lower timeframe:
-Price broke upward Trend Line.
-Price Removed Pivot Point Demand Zone
-Rally Base Drop Created
-Sell pullback with 3:1 TP

RUSSELL2000:FUNDAMENTAL NEWS+NEXT TARGET | LONG SETUPRUSSELL 2000 FORECAST:
The Russell 2000 tumbles as U.S. inflation rises at the fastest pace since 1982
Lack of progress in peace negotiations between Russia and Ukraine also weighs on sentiment, accelerating the sell-off on Wall Street
The Russell 2000 near-term outlook remains bearish from a technical perspective
The Russell 2000 fell Thursday in midday trading, sinking about 1.3% to 1,990, weighed down by risk-averse mood due to rising geopolitical tensions and rampant inflation in the United States. Investor sentiment improved briefly yesterday on expectations that the crisis between Russia and Ukraine could begin to de-escalate soon, but the winds shifted again today after high-level talks between the two countries' foreign ministers failed to produce any progress towards a ceasefire.
To make matters worse, U.S. CPI continued to accelerate and reached 7.9% year-on-year in February, its highest level since 1982, driven by rising fuel, food and housing costs.The commodity market price shock of the past few days did not influence data for this period, so we can effectively say that inflation has not yet peaked, and that much higher readings are likely in the coming months.
Mounting price pressures will lead the Fed to raise interest rates multiple times in 2022, starting at next week's meeting, although the hiking cycle may be less aggressive than anticipated earlier in the year amid extraordinary uncertainty stemming from the military conflict in Eastern Europe. In any case, the direction of travel is toward less accommodation and tighter financial conditions over the forecast horizon.
The transition to a more restrictive monetary policy environment, coupled with weakening activity, runaway inflation, and the war in Ukraine, will ensure that volatility remains elevated for the foreseeable future, complicating the equity market recovery, particularly for cyclically oriented companies that are highly dependent on healthy GDP growth. This leaves the economically sensitive Russell 2000 in a precarious situation and vulnerable to near-term weakness.
From a price action perspective, the outlook is bleak for the Russell 2000. Looking at the daily chart, we can see that the index is currently trading below its 200-day, 100-day and 50-day simple moving averages, and has been making lower highs and lower lows in recent months, two bearish signals that reinforce the argument that the path of least resistance is south.
In this regard, if the small and mid-cap stock benchmark stays on a downward trajectory, bears may attempt to launch on assault on 1,890/1,895. This technical support, defined by the 38.2% Fibonacci retracement of the 2020/2021 rally, has been tested twice in recent weeks, successfully repelling sellers each time. Should it be tested again, we may see a bounce from these levels, but if the floor breached, all bets are off, with a breakout exposing the 1,815 region.
On the flip side, if buyers return and bid price higher, resistance is seen near the 2,065 area, where the March high aligns with the 50-day SMA and a descending trendline in play since November last year. If bulls manage to push the index above this barrier, the next upside focus appears at 2,105 (February high). A sustained move above 2,105 and monthly higher high is required to resuscitate buying momentum and improve the near-term outlook.

Russell 2000: Head & ShouldersMajor Pattern: Reversal Bearish Head & Shoulders
Minor pattern: Descending Triangle
Possible reversal formation Wedge??

Russell 2000 Macro Outlook1750 within 4 weeks, followed by melt-up to 3000. 40-60% bear market after. 1.618 Fibonacci will be respected in cycle top. Top H2 '22 / H1 '23. Unfortunately, fundamental supporting research is private.

Russell 2k Can't Get Traction TodayNice bull moves in S&P and Nasdaq today, but Russell not joining in the party. Last few hourly bars here showing bulls trying to defend support but bears keep pushing down. I like this for an afternoon short play if market sells off.

Bullish Dragon with a 1.618 Max Target on SmallCap 600 Value ETFThe Small Cap Value Seems to be in a much better position than the rest of the market and in the case that the market Bullishly Reverses we may see the Small Caps severely Outperform the Indexes. This could lead to the Small Caps making a Minimum 88.6% Fibonacci Retrace from High to Low and a Maximum of a 1.618 Fibonacci Extension before we have the potential for further downside.

Russell 2000: FUNDAMENTAL + NEWS INFOs | LONG SETUPRUSSELL 2000 FORECAST:
The Russell 2000 tumbles as U.S. inflation rises at the fastest pace since 1982
Lack of progress in peace negotiations between Russia and Ukraine also weighs on sentiment, accelerating the sell-off on Wall Street
The Russell 2000 near-term outlook remains bearish from a technical perspective
The Russell 2000 fell Thursday in midday trading, sinking about 1.3% to 1,990, weighed down by risk-averse mood due to rising geopolitical tensions and rampant inflation in the United States. Investor sentiment improved briefly yesterday on expectations that the crisis between Russia and Ukraine could begin to de-escalate soon, but the winds shifted again today after high-level talks between the two countries' foreign ministers failed to produce any progress towards a ceasefire.
To make matters worse, U.S. CPI continued to accelerate and reached 7.9% year-on-year in February, its highest level since 1982, driven by rising fuel, food and housing costs.The commodity market price shock of the past few days did not influence data for this period, so we can effectively say that inflation has not yet peaked, and that much higher readings are likely in the coming months.
Mounting price pressures will lead the Fed to raise interest rates multiple times in 2022, starting at next week's meeting, although the hiking cycle may be less aggressive than anticipated earlier in the year amid extraordinary uncertainty stemming from the military conflict in Eastern Europe. In any case, the direction of travel is toward less accommodation and tighter financial conditions over the forecast horizon.
The transition to a more restrictive monetary policy environment, coupled with weakening activity, runaway inflation, and the war in Ukraine, will ensure that volatility remains elevated for the foreseeable future, complicating the equity market recovery, particularly for cyclically oriented companies that are highly dependent on healthy GDP growth. This leaves the economically sensitive Russell 2000 in a precarious situation and vulnerable to near-term weakness.

Messy Open but Russell Futures HoldingWhile S&P and Nasdaq futures have fallen after open, the Russell 2k futures are holding. It's a mess but based on action alone could be a long trade here.

Russell Long Off Hourly SupportNice risk reward here long on hourly chart with morning star pattern on support and price extended from 20 ema.

S&P500 and Russel 2000 : Mixed SignalRussell 2000 is showing a text book example of Up Trend followed by Sideways move and then down trend. It has broken the range and going down. But S&P500 is still sideways, not yet broken the sideway support. So two indices are not in sync. Let us wait to see if S&P breaks supports and follows the Russell 2000 or continues to go sideways?

RUSSEL 2000: DOWNTREND | PRICE ACTION IN BEARISH CHANNEL| SHORT Bigger isn't always better.
Case in point: Lots of trading desks are locked in on the dramatic underperformance of the small-cap Russell 2000 Index amid the bounce-back in broader stocks from the late January lows. The Russell 2000 — which is often viewed a proxy for the strength (or lack thereof) of the domestic economy — is down 10.5% this year compared to a 6% drop for the S&P 500 and 3.6% decline for the Dow Jones Industrial Average.
The Russell 2000 has lagged the S&P 500 by 25 percentage points in the past 12 months, its worst 12-month relative return since 1999, notes Goldman Sachs' David Kostin.
"Decelerating GDP growth has been one headwind to the cyclical small-cap index. During the last 20 years, small-caps have lagged on average in periods when the yield curve was flattening, economic growth was strong but decelerating, or financial conditions were tightening," Kostin says.
Traders are now trying to determine whether the weakness in the Russell 2000 suggests another pullback in the markets is in the offing. After all, larger cap stocks are exposed to the same things (tightening financial conditions, higher interest rates, inflation, etc.) as smaller companies.
"The small cap Russell 2000 has been a “canary in the coal mine” for stocks for much of the past year — first warning softly as small cap momentum peaked along with other areas of euphoric sentiment in 1Q21 even as large caps continued to rise, and then more urgently as its breakdown from a year long range led the broader market lower. As stocks bounce from their January slide, though, small caps have shown signs of sputtering below their prior support. Floors can often become resistant when broken, and with the Russell 2000’s recent track record as a leading indicator for broader market weakness, we will be watching the reaction to this level closely. Failure would suggest further correction in stocks lies ahead, while a break above could indicate stabilization," explains Evercore ISI's Julian Emanuel.
Of course, the Russell 2000 sucking wind could mean absolutely nothing to the S&P 500's next big move. No analysis is fool proof. Just file this under your "Things to Watch List," especially as the bulls begin to resurface and blow their normal smoke in your face.
Now go forth and conquer in what will be another mentally draining week of corporate earnings. Happy trading!

IWM - Looks like small caps might be in for a bit more hurtThe daily chart from the Covid crash to the peak of the Covid recovery paints a picture of the Russell 2000 that is eerily similar to a textbook sketch of Wyckoff's distribution theory.
For the bulk of 2021 IWM respected a very clear support line that has been crashed through in 2022. Recent price action shows that old support being tested as a new resistance and buyers attempting to push prices through that level were flatly rejected. Furthermore, volume began spiking on drops in price below the 200 day moving average and any movement above it recently was met with anemic volume. This is not the excitement that we've been accustomed to in the small caps of 2020.
The game has changed.
With 1/3 of the Russell (at least) being non-revenue producing speculative companies that were exponentially over-valued during the 2020 bull run, it's hard to imagine that the grounding of the Russell isn't real and that it isn't coming. In today's market, giants like TSLA, AAPL, and MSFT are being dragged down to fundamental value. The small caps aren't immune, unfortunately. What's even worse is that a correction to AAPL's charts isn't as ghastly as some small caps that are trading at tens or hundreds of millions above their quarterly earnings.
The Russell is an important index to watch if one is interested in small cap boomers. It serves as not only a tradable ETF but as a thermometer for the sentiment toward speculation. Right now, it appears that bullish sentiment and risk taking is waning and bearish sentiment is growing. This could lead to a gut wrenching performance for small caps going forward into 2022 and larger drops in former penny stocks that retail investors drove to epic heights in 2020 and early 2021. Many of these companies are still heavily overvalued after 50%+ drops in share prices.
I'd expect volatility in the coming months as tax returns are pumped into these old favorites with the rallying cries of "buy the dip" and "moon next PR" on the breath of most novice investors and traders, especially those who are holding bags likely exponentially higher than current share prices. Once that surge of small money ends I would think that an abysmal summer is approaching for many of these strongholds.
Most of the companies have made lofty promises and many of them have targeted this summer for validation of their business models and strategies. But in the face of generationally high inflation, wars, rate hikes, and supply chain disruptions along with a pandemic that is cyclically impacting humanity, will it matter?
If Mr. Russell is any indication of what is to come, that answer is likely no. Spiking prices will likely be met with hard sell-offs and shorts that start to feel the squeeze will get a layer of protection from the trapped bulls just looking to get their money back out of the markets.
It's not the best of news, but it shouldn't be considering that we aren't in the best of economic situations currently. Of course this is the markets and the markets have a mind of their own. It's wise not to get too caught up in bias and predictions to the point where you are unable to react appropriately and according to your plans.
Good luck out there and God bless!!

Russell2000 Held at 2100 Support, Counter Trend Move to 2280Trend Analysis
The main view of this trade idea is on the 15-Min Chart.
Support appears to have held at around the 2100 for the Russell 2000 Index (US2000). This is corroborated by the US2000 crossing above its medium term (195-MA) moving average. Also the Supertrend broke above its 2146 resistance above the last trading session. When observing the technical indicators there is a unique pattern on the Awesome Oscillator (AO) and the RSI. There is positive price divergence with the indicators. The AO is above 0 and the RSI is greater than 50. It is expected that US2000 rallies towards the 2280 price level. Failure of this move will be seen if US2000 declines below 2100.
The Point and Figure chart as well is showing a bullish reversal. Support is seen around 2110 and the Index rallied above its short (30-MA), medium (100-MA) and long (200-MA) moving averages. There are also positive crossovers with the short and medium as well as short and long term MAs. The AO is above 0 with the RSI trading above 50.
The longer term view remains corrective for the US2000. Resistance is observed around 2185.
Recommendation
The recommendation will be to go long at market, with a stop loss at 2100 and a target of 2280. This produces a risk/reward ratio of 1.70.
Disclaimer
The views expressed are mine and do not represent the views of my employers and business partners. Persons acting on these recommendations are doing so at their own risk. These recommendations are not a solicitation to buy or to sell but are for purely discussion purposes. At the time of publishing I have exposure to US2000.
