Russell2000 Correction CompletingIN this update we review the current corrective cycle in the Russell and identify the next high probability trading opportunity
Russell2000

20 year elliott wave analysis ($iwm)someone asked me this evening if i thought iwm was in a phase of distribution right now- so i decided to take a deep dive into the entire history of this chart, and here's what i've come up with.
no, i do not think it is in a phase of distribution, instead it actually looks like a massive bull flag - in elliott wave theory terms, i'll call it a double or triple three - hard to say for now, since it is only halfway through this flat corrective phase.
my low ball long term upside target for iwm is at $335, high ball would be $375
this is in confluence with my 12 year spy analysis, you can view it down below:
ps. flat corrections can take a really long time to resolve, so i'd wait for a definitive break out, and a retest of the entire channel that it's in right now before attempting to play that upside swing.

US2000 Russel Supply And Demand Analysis-Price broke out of 1 year range.
- Looking for long positions if price pulls back
into the RBR demand using it as support/ breakout
restest zone.
-Confirmation on LTF

US Indices Weekly Analysis | November 16, 2021While the Russell 200 & the Dow Jones saw a bullish breakout last week, the S&P500 is lagging behind its peers. The Nasdaq also saw some strong price action recently, leaving S&P500 to lag behind the pack. Here are the key levels to keep an eye on!

Russel 2000 Continuation TradeIn this update we review the price action in the Russell break out trade and identify the next high probability trading opportunity

RTY - possible tradeIt's a choppy friday.. Russell is holding up well.. looking for a break below to sort.. May decide not to take trade this late of Friday...


S&P 5,000,000The talk of the town is the Market is overdue for a plummet!
Fun fact: This has been the narrative for the last decade as far as I am aware.
It's more likely that the major indicies will continue grinding up or even go sideways a bit.
This chart certainly appears to signal "euphoria". It looks overextended, parabolic, intimidating, right?
Now if we press the reality button labeled "log" it will adjust the chart based on percentage change. Then like magic, we can adjust the visual scale and BOOM, it's all gone. Of course the ideal chart to use lies somewhere in the middle. But when looking at a long term chart with large numbers, always use log scale. (Try it on Bitcoin)
What are we even worried about?
Suppose we do get a sell off. Let's measure out the damage from the Global Financial Crisis. We find more number magic with the percentage gains going up are far greater than while going down.
What about the looming Solvency Crisis?
"What if's" are not going to make anyone money unless you're the one selling click bait articles. But there is a way to trade this and still feel safe. Here are the conditions...
Put on a 1 Hour chart, buy dips, sell rallies. Each short term rally is about $50-$100 on the S&P500 and the benefit of short term trades under the conditions below helps steer clear of "crisis" danger.
1. (Daily) MACD is above zero
2. (Daily) EMA is acting as support
3. (1 Hour) RSI dips to bottom channel
There you have it. Feel free to stay on the sidelines with Peter Schiff and Steve Van Metere but this is my strategy for trading micro ES futures up until September 2021.
Will post active trades below.
Trading is risky. Don't do it.

RUSELL 2000 Close to break 10-Month LateralHi,
You can wait for it to confirm the lateral breakout and retest the broken level.
If the RUSSELL 2000 breaks this 10-Month lateral movement from my POV is the best signal that we are still in a bull run, and at least we've a 10% upside potential.
Luck!

#IWM finally broken out of channelFinally, after consolidating within this box structure all year, small cap stocks have broken out and look to have at least 10% upside from the breakout level before the full channel target is reached.

$RTY | UPDATEAlmost at the wave 3 target, upside limited in my opinion. Wait for the wave 4 dip. It will be a gift in the market.
Thank me later.

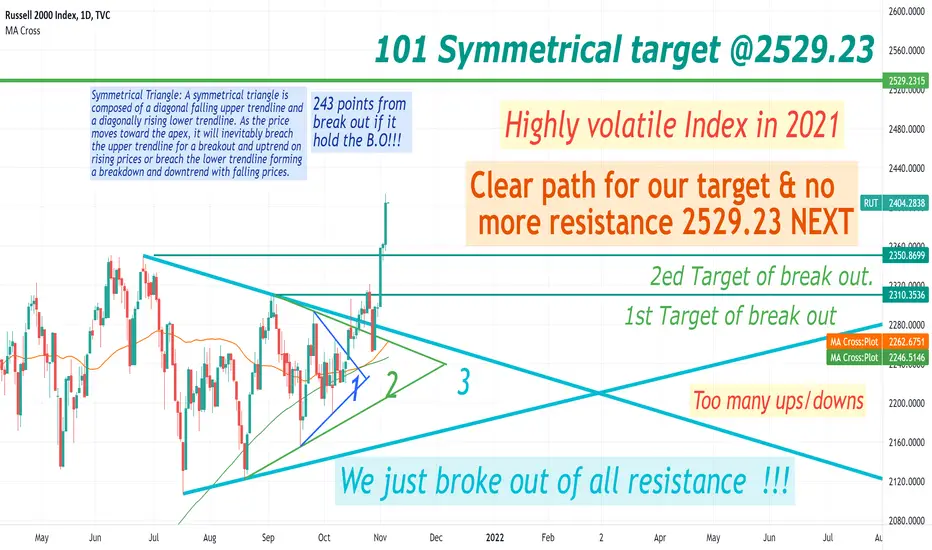
Hard to analyze W/ high volatility in 2021 !Symmetrical Triangle: A symmetrical triangle is
composed of a diagonal falling upper trendline and
a diagonally rising lower trendline. As the price
moves toward the apex, it will inevitably breach
the upper trendline for a breakout and uptrend on
rising prices or breach the lower trendline forming
a breakdown and downtrend with falling prices.
Russell 2000 finally breaks out of consolidaton.RUT breakout from a consolidation in place since March. Look for the prior uptrend to continue.

Russell 2000 measured move after the breakoutRTY/IWM looking for a measured move after a long consolidation. I'm thinking it will retest the high of 2366 before the run.

$RTY | TRADE IDEALimited upside left on this wave 3. Wave 4 pullback to retest the breakout will be a GIFT. Targeting $2555 from there.

Small caps consolidation over?$IWM small caps may have just broken out of their consolidation phase that lasted quite a while.
We may know soon if it is legit. Needs volume still. Also, may need re-test at some point. Keeping
watch.

Small caps are waking up! Knocking on all-time highs door.After nearly 9 months of consolidation we're seeing the Russell 2000 wake up here into the end of the year while volume picks up. Keep an eye on this weekly close for breakout confirmation.

$IWM Going to send it.Symmetrical triangle with a large consolidation base. All VWAPs and EMA clouds are under and supporting price. Current price is starting to emerge out of volume profile as well. Should be a good rally although macros like these tend to be multi-month holds at a minimum to play out well.

2022 could be the year of small cap stocks/cryptosThe first chart shows the Russell 2000 compared to the S&P 500, hence the stength of small cap stocks. Digibyte is just an example but you see a similar picture in many pennystocks, cryptos and small cap stocks.

Russell2000 Trading Wave 5 In this update we review the set up for a wave 5 extension in the Russell

RTY1! - Wedge Back-TestThe Yearly Bull Flag continues as The Russell 2000 consolidated back to test the wedge pattern. Guided down today by the 2 hour 8 EMA, the Bollinger Bands have opened up and fallen away. Support was found at the Daily MBB.

