Early sign of correction..!Nasdaq 100: Dark cloud cover= correction
S&P 500 and Dow Jones : Bearish engulfing = Correction will be most probable scenario
Russell 2000: Bearish kickers = Correction will be most probable scenario
Overall correction is the most probable scenario!
Russell2000

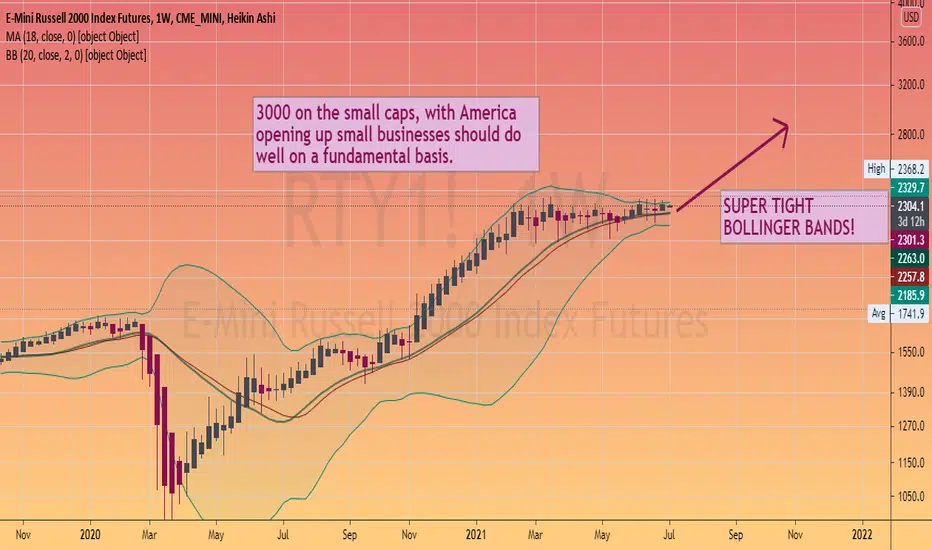
Small Caps, #russel2000 index - #US #stocksIs this poised to break out to new all-time highs
a major move is imminent
probabilities should be up

RUT Motive Impulsive Response to May 18th Triangle completion Look to place some +ve Delta Butterflies on RUT or Bullish verticals to capitalize on this move

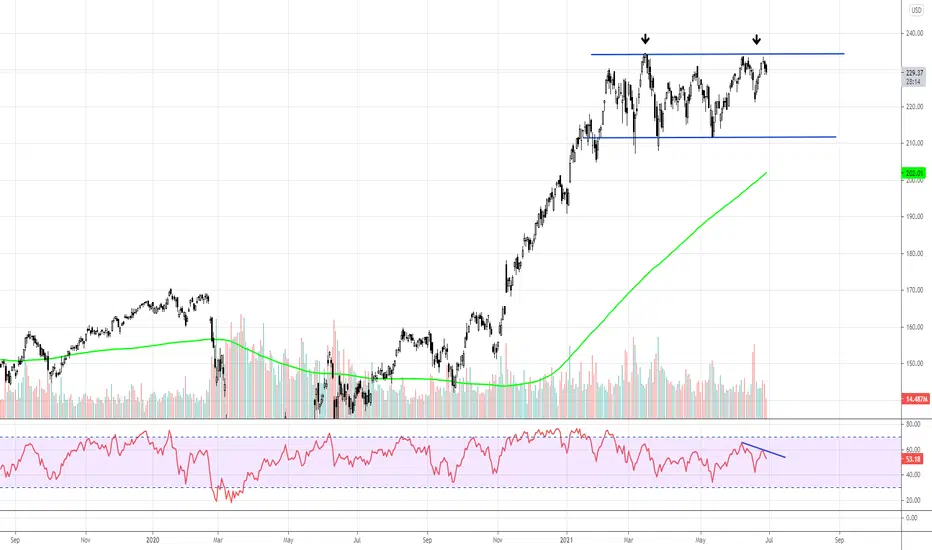
#IWM US Small cap stocks rolling over?Third test of resistance and failure to rise to new highs on the Russel 2000.. Possible that we see a retest of the bottom of this channel..
Secular bull market in Russell 2000 looks to be done....The secular bull market in Russell 2000 looks to be done...


Ammo Inc. ($POWW) - Excellent Risk and Reward OpportunityAmmo Inc presents itself as an excellent opportunity in a market where a large number of stocks are significantly overvalued. Ammunition, as we know it, has been booming for a while since the pandemic and we're now in a shortage, which has allowed this business to position itself very nicely going forward.
Roth has labeled a $9 price target on the business. Subsequent to the valuation, it was announced that Ammo Inc. has been included in the June 4th preliminary list of member additions to the Russell 2000® Index and the Russell Microcap® Index, which become effective upon the opening of the US stock markets on June 28, as part of the 2021 Russell indexes reconstitution.
About (taken from their website):
AMMO, Inc. is a high-quality, technology-driven ammunition U.S.-based company; from our patented STREAK (R), HyperClean, and military ammunition technologies, to the latest and best manufacturing technology in the industry. Our manufacturing facilities and processes meet or exceed all SAAMI and MilSpec specifications.
Fundamentally, the company has established itself well and the underlying data can be found at FinViz
Technically speaking, the Risk/Reward opportunity is excellent. We can see it has broken out to the upside and has retested the $7.00 mark (the upper trend line) to validate the breakout. Let's be mindful of where this stands after next Friday's close. If we close below $7.00 next Friday, I'll be unwinding my position.
I have marked the Stops and Take Profit levels here accordingly.
Good luck and be sure to maintain your stops accordingly.

BONDS UP MARKET DOWNWith a stronger dollar surging into the markets, expect anything against the dollar to retrace for a pullback. I am overall bearish on DXY. but for the meantime expect institutions to buy into TLT expecially after this month's Fed decision on Rates.

Traditional market analysis 12/06/2021 #3Hello everyone! Once again I'll have to repeat myself by saying that despite the fact stocks are overvalued, there could be much more upside. Given the way central banks and governments are acting, it is hard for me to see stocks reversing any time soon. Yes there will be some pretty strong corrections along the way and at some point a big bear market. But to me it looks like we are more in a situation like we were after breaking above the 2000-2008 highs or in 1987 than we are in 1970s or 2000s.
Other than the US all other stock markets were very depressed for 1 or even 2 decades. European stock markets have been showing a lot of strength and their charts are indicating significant upside from here rather than downside. Below I have added some European indices which all seem very very strong and with significant upside potential. In 2020 and so far in 2021 we had the US initially show most strength, then Asia and now Europe.
Of course this doesn't mean the US market is in a bad spot or anything. Quite the opposite. Actually European markets doing well is a very good sign for the risk on sentiment. Bond yields have been going lower in several places although some Central banks are raising rates. In my opinion in the EU and US we won't see higher rates any time soon and there is no other way out of this massive debt hole we are in. To me negative real rates are boosting stocks, as long as we don't see Oil getting completely out of control. As long as oil stays below 100$/barrel for some time and doesn't shock the market we could be OK. The same goes for most important commodities and especially Copper.
Currently the Russell 2000 is looking like it is about to come out of long period of re-accumulation. The Russell 3000 seems to be in a very strong uptrend that has the potential to continue even higher. We have no idea how massive this bubble could get as the biggest bubble is actually in the bond and currency markets. At least that's my opinion at the moment. This doesn't mean I think we will have hyper inflation or sustained inflation for more than 2-3 years, but it isn't impossible. Unfortunately policy makers are taking a ton of bad steps that are compounding little failures in the 'system' and eventually that will break either through social arrest or a market collapse. It's just not time yet and markets aren't that irrational yet... so dips are for buying and currently being long seems better than being short.
Where am I wrong at least for the short term? If the Russell 3000 closes below 2350. That's where my mental stop loss is.
s3.tradingview.com
s3.tradingview.com
s3.tradingview.com
s3.tradingview.com
s3.tradingview.com
s3.tradingview.com
s3.tradingview.com
s3.tradingview.com

S&P500 still looking bullishIn terms of the global economy the flood of liquidity and government aid has been papering over the cracks which I don't know when or whether they are going to break. The situation isn't pretty, yet the markets don't really seem to be worried about anything long term. Inflation doesn't seem to be that much of an issue yet and markets just keep going higher thanks to the liquidity injections, people having more access and overall the bubble doesn't seem to over.
For the SPX500 a dip to 3990 would be very healthy and a great buying the dip opportunity, although it might come after we touch the top diagonal first and currently SPX is bullish across all timeframes and still sitting above support very nicely. I'll create some ideas pretty soon supporting this one regarding other asset classes that people might find interesting so stay tuned!
The bull market in stocks is getting stretched and there are some signs of weakness in some, but there aren't signs of extreme froth either. I've been very big on the idea that the bull isn't over and won't be over any time soon, although a 15-20% correction probably isn't far away. So far corrections have been very shallow and in my opinion we'll get a big drop at some point. For now though everything looks pretty bullish. Chinese stocks have shown significant strength and they have held their bullish structure. A little dip from here would be ideal for going long. Russell 2000 and Nikkei have been extremely weak, but I am still not sold on the idea that they will go into a large dip soon. The Nasdaq 100 is looking weak, yet I see nothing worrying. The DAX has been one of the most bullish ones along with other European indices, however it is one of those that worry me a little bit more in the short term as every time it broke above ATHs it then collapsed and currently it has a bit of


Flat and fragile..! when you look at Inflation adjusted..!I believe the best bet is betting on the most probable scenario..!
let's look at the 8 companies with the highest market cap :
Obviously, we do not see any increase in Trading value in the past 2 months!
What is an outlier in statistics?
An outlier is an observation that lies an abnormal distance from other values in a random sample from a population. ... Examination of the data for unusual observations that are far removed from the mass of data. These points are often referred to as outliers.
The historical average stock market return is 10%, so March 2020 to February 2021 was an outlier from a statistical point of view!
and less likely to happen again soon!
In the past 3 months, inflation-adjusted market performance is not positive! which means the market did not buy the theory that stocks will perform like other goods in the time of accelerated inflation!
I believe it would be better to say the stock market has already adjusted the stocks' price in the past 17 months!
The S&P 500 Index originally began in 1926 as the "composite index" comprised of only 90 stocks. According to historical records, the average annual return since its inception in 1926 through 2018 is approximately 10%–11%. The average annual return since adopting 500 stocks into the index in 1957 through 2018 is roughly 8%.
says that the average DJIA return from 1896 is 5.42%
So I believe it is highly unlikely that we see a huge movement like March 2020 to February 2021. But constant money circulation in the market will provide small opportunities that we can take and wait for the next one!
Reference:
www.investopedia.com

Comparison between what I published and what happened this weekI believe it is good to review how functional our analysis is.
I want to share the multi-timeframe analysis I published last week for my Patrons/private subscribers, and let you judge about the accuracy of the contents!
TVC:NDX
Hourly Chart: Bearish Bat ( Bearish )
Daily Chart: Filling the Gap, Triple Doji means no enough energy to go further. (Neutral-Bearish)
Weekly Chart: Supported at the lower level of the regression channel (Neutral- Bullish )
Monthly Chart: Hanging Man ( Bearish )
Conclusion: After 2 bearish weeks, we had 2 bullish weeks but May ended with -1.26% performance, crossing below last month low is not a good sign..! Neutral to Bearish is the most probable scenario.
TVC:SPX
Hourly Chart: bearish bat ( Bearish )
Daily Chart: triple Doji and rejection at resistance level ( Bearish )
Weekly Chart: at the midline of the regression channel (Neutral)
Monthly Chart: dragonfly Doji after 3 fantastic months(Neutral-Bearish)
Conclusion: Neutral-Bearish is the most probable case.
TVC:DJI
Hourly Chart: bearish bat ( Bearish )
Daily Chart: triple Doji and rejection at resistance level ( Bearish )
Weekly Chart: at the midline of the regression channel (Neutral)
Monthly Chart: we had 4 positive months in a row but in the last 3 months the energy to go up further became less and less (Neutral-Bearish)
Conclusion: Neutral-Bearish is the most probable scenario.
TVC:RUT
The Russell 2000 index , created in 1984 by the Frank Russell Company, is comprised of 2,000 small-capitalization companies.
The index is frequently used as a benchmark for measuring the performance of small-cap mutual funds.
Many investors see its breadth as giving it an edge over narrower indexes of small-cap stocks.
In the past 2 weeks, RUT 2000 experienced a +7.3% gain.
As II previously said, this recent rally would not be considered a bullish market because of the low trading volume, but it is a part of a complex correction! I believe this situation could last for the next 1-2 months.
Most probable scenario:
A: If we see lower money flow: Bearish breakout (I think this is the most likely to happen)
B: If we see an increase in money flow: Bullish breakout ( If 6 trillion dollar bill pass fully, this could be the case)
Some People think I publish my post to bait people to subscribe to my servises!
I challenge them to publish their own analysis and next week we will review whose work has a higher rate of accuracy!

This is not healthy circulation of money in the market!In the past 6 trading days, Major indexes become flat.
Nasdaq traded in a narrow range of 1.19%, S&P 500 range was 1.53, and Dow Jones 1.74!
On the other hand, Meme stocks moved Russell 200 +4.73 in the same time period.
Today AMC's trading value was 47.942 Billion dollars, while many think this type of price pattern is a result of a united rebellious retail trader group, I think this is not!
When the trading volume of a company with 450 million total outstanding reaches 3.345 Billion in the past 7 days, It means Quant Funds are
heavily involved to provide the liquidity..!
WallStreetBets is a community of 10.2 million people on Reddit. But who are the directors of this perfect show?
I call it perfect because it can produce a very similar pattern in different assets!?
I believe there is a team that is very specialized in social media, algorithmic trading, and access to enough capital to seduce +10 million people to the destination washed out!
why should these two different stocks behave so similarly???
AMC vs GME
I study these patterns for a very long time and even predicted a price range of 60-100 for today:
The leaders of this group are very familiar with the power of social media, pyramiding, and creating the sense of FOMO.
Many beginners just look at the bright side, but this coin has a dark side too, like losing 89% of your money in 5 days!
Stay out of this madness! the winner is the one who manages the risk better!
Moshkelgosha

Small Cap Party is about to finish..! (Bull Trap)As I mentioned before, this recent bullish move is a part of a complex correction in small caps, and it is very unlikely to be repeated in the next 2 weeks!
Looking at the 10 biggest company based on the Market cap will show the reality behind my analysis:
1- NASDAQ:CZR
2- GME
3- NASDAQ:PLUG
4- NYSE:AMC
5- NYSE:RH
6- NASDAQ:PENN
7- NYSE:DAR
8- NASDAQ:NVAX
9- NYSE:DECK
10- NYSE:CLF
Obviously, nothing special happened and there is no money flow in these stocks but AMC..!
buying inverse ETFs like SRTY (-3x) would be a better option with lower cost to benefit from the next AMC crash..!
AMEX:SRTY

RTY1! (Russel) : 2 areas of potential bullish reactionPrice could dip into discount, mitigate some 4H zones and then go higher.
Wait for confirmations before going long. GLGT.

IWM Long, why not?Im surprise that Russell has not gone down or at least give into a healthy pullback to 190. There are so many stocks in this ETF that are trading relatively high to pre-covid prices. This ETF is juiced up with fed money. Its unbelievable! Sooner or later its gonna want more? More stimulus money, WTH? Why not?
Three weeks ago the uptrend channel was broken and this week its trying to come back to it. With the US economy coming out of the pandemic, it makes sense for IWM to come back to the uptrend channel? MACD just crossed so maybe its gonna go up. Does Russell range bound until the earnings come out in July or it can't wait any longer. I think its going up. Fed wins.

Complex Boring Correction..!The Russell 2000 index, created in 1984 by the Frank Russell Company, is comprised of 2,000 small-capitalization companies.
The index is frequently used as a benchmark for measuring the performance of small-cap mutual funds.
Many investors see its breadth as giving it an edge over narrower indexes of small-cap stocks.
In the past 2 weeks, RUT 2000 experienced a +7.3% gain.
As II previously said, this recent rally would not be considered a bullish market because of the low trading volume, but it is a part of a complex correction! I believe this situation could last for the next 1-2 months.
Most probable scenario:
A: If we see lower money flow: Bearish breakout (I think this is the most likely to happen)
B: If we see an increase in money flow: Bullish breakout ( If 6 trillion dollar bill pass fully, this could be the case)

AMC looking extremely bullish after a perfect breakoutAMC has finally broken 14.5 for real and seems pretty strong. The more times this resistance is being tested, the more likely it is that the breakout is real. We have seen strong re-accumulation based on the volume profile in the 14$ area which just turned into support. Below I have the charts which unfortunately are in a format from tradingview that have to be clicked and they don't show up immediately (no idea why).
The point here is that AMC has a significant short interest, there is a lot of hype and many diamond hands behind it... And is a company that benefits from the re-opening. This company almost went broke but now it is looking very healthy and the capitulation and the support from WSB has actually given the company a boost. Unlike GME the January squeeze was smaller and the second pump was a little cleaner and not as extreme as GME's. The current valuation of 6B in my opinion is OK, but the interest in the company from WSB + re-opening + relatively high short interest could make the price go above the old ATHs.
For now the first target is around 17$, the second target around 21 and then we could see the ATHs at 35t$ get broken. It definitely wouldn't be that hard to test them and then break them as the stock is already only 55% below its ATHs, which were also a double top. Double tops eventually get broken except if the company goes broke, especially if they get retested after a 94% which is a great way to wipe out weak hands.
For those in Crypto that follow me, you can go long/buy AMC on some platforms like FTX and Bittrex although they have commissions and they aren't as great as the typical brokers, but it is way to stay in crypto by buying tokenized stocks. On FTX and Bittrex you own the stock and can trade it 24/7, while there is also SimpleFX where you can deposit crypto and use it as collateral (so it is like 1Broker and has risks). There you trade CFDs with and you do it based on normal trading hours.
s3.tradingview.com
s3.tradingview.com

US2000 Strong Buy US2000 Russell 2000 Strong buy, look for new high.
Technical indicator analysis & chart analysis.

Everything Bubble could be the case..!How possible is another Bullish rally???
To answer this question let's review some important fundamentals.
In the next few paragraphs, I will use a great article about Bubble by Investopedia and provide a real-life example and let you judge at the end.
Since everyone could have misconceptions about certain issues, please feel free to write your contradicting views and help me learn from your ideas.
What Is a Bubble?
A basic characteristic of financial bubbles is the suspension of disbelief by most participants when the speculative price surge is occurring.
( My view: Almost everyone thinks there will be another Bullish rally soon. Check box number 1: filled)
Bubble, in an economic context, generally refers to a situation where the price for something—an individual stock, a financial asset, or even an entire sector, market, or asset class—exceeds its fundamental value by a large margin.
Financial bubbles, aka asset bubbles or economic bubbles, fit into four basic categories:
stock market bubbles
market bubbles
credit bubbles
commodity bubbles
Let's evaluate them one by one!
A: Stock market Bubble: I would to like use Buffet Indicator, The Buffett Indicator is the ratio of total US stock market valuation to GDP. The Buffett Indicator was at elevated levels before the dotcom crash of 2000 to 2002, and before the financial crisis of 2008, but at respective values of 137% and 105%, lower than today's reading of 158%. (check box 2 filled)
Sector Bubble: Some sectors like EV makers, green energy stocks, AI, Aerospace, and cryptocurrency-related stocks have been in a deflationary state since 3 months ago. (check box 3 filled)
B: Market Bubble: Cryptocurrency market :
After a +2300% gain in less than 14 months just lost 50% of its market cap in less than 2 weeks! (check box 4 filled)
C: Credit Bubble:
Margin debt stands at $847 billion highest number in the last 10 years..!(check box 5 filled)
US Published National Debt:+ 28 Trillion (+133 Trillion is an alternative reality which means 855k/Taxpayer) (check box 6 filled)
D: Commodity Bubble:
Agricultural futures: everything is up between 10-303% in the past year. (check box 7 filled)
Energy futures: everything is up between 53-111% in the past year. (check box 8 filled)
Metals futures: everything is up between 9-92% in the past year. (check box 9 filled)
The five steps in the lifecycle of a bubble:
1- Displacement
2- Boom (March 2020- February 2021)
3- Euphoria (February-April 2021)
4- Profit-taking (April- May 2021) 76% of stocks trading below their relative volume which means no new money coming to the market. (check box 10 filled)
5- Panic (Not started yet)
Another concerning factor is the sharp drop that happened after earnings in most stocks!
No need to say Gold started a new rally and seems it has no intention to correct in the past 2 months.
Most importantly, I believe I have discovered a mathematical way to calculate the last stage of any bubble with acceptable accuracy..!
Those who follow my work know it is not a baseless claim. I will provide some example:
1- EV makers Bubble: NIO was 57
2- Bitcoin: was 64-62
Based on my calculation: It is highly likely that we experience another round of sell-off by the next 4 weeks or sooner!
I provide atleast 10 reasons for my bearish case, I would like to know what are your reasons for another Bullish rally?
Cryptocurrency Market:
Margin Statistic:
U.S. Published National Debt:
www.truthinaccounting.org
Bubble:
www.investopedia.com

SP500 - Can The Bull Market Really Continue?Idea for SPX:
- Stock market is at a 100 year old resistance.
- Can it really continue its parabolic bull run?
- Here is an interesting fractal of the 20s to 50s, which closely matches with the current market conditions from the late 90s.
- Right as the market hit the resistance, it did see a minor pullback and slowed for a year, but then continued its way up glued to the trendline for 10 years afterwards.
Past performance does not guarantee future success, but based on this fractal, it is definitely not out of the question.
Pullbacks are normal, so it is inevitable that we will have one, but this time, will it turn into more than just a minor pullback? That's a good question.
GLHF
- DPT
