Russell2000

RTY July 2020 post 4th FACE RIP?!Lets see where she goes. I like the look of this IH&S structure. Re-balanced just means it should go up..

July 5 Market Update | Technical, Fundamental, NewsDescription:
An analysis for the week ahead.
Points of Interest:
Low-Volume Above $3,150; $3,200 Balance; Tech Overextension; Weakness In Financials, Energy.
Technical:
Broad-market equity indices one time framed higher last week, evidenced by the higher highs and lows on the daily time frame, and closed the week off near a resistive low-volume area.
Recapping last week’s action, on Monday, the S&P 500 established a higher low, above the year-to-date volume weighted average price, and squeezed on good delta, through resting liquidity at and above $3,020.
After Tuesday’s challenge higher, the S&P retested $3,100, a high-volume area, and balanced Wednesday, building value and acceptance of $3,100 as evidenced by the responsive participation intra-day.
On Thursday, the U.S. economy added greater than expected payrolls, driving prices higher at the open, before establishing excess and fading to close the gap below.
Overall, though extended, the market is at an important technical level. Breaking further into the prior low-volume resistance would point to a change in sentiment, quashing the initiative activity that drove prices lower in the first place.
Looking beyond the broad market indices, the innovation-driven, technology-based sectors are extended while relatively weak sectors, such as energy and financials, suggest bigger selling may be around the corner. For a continuation higher, buyers must step up on dips and increase participation in search of higher prices, helping ensure value follows closely behind.
Scroll to bottom of document for non-profile charts.
Key Events:
Non-Manufacturing Activity; Final Composite And Services PMI; Initial Claims; Wholesale Inventory; PPI; Consumer Credit; JOLTS.
Fundamental:
The Federal Reserve destroyed price discovery and delayed the inevitable. yhoo.it
Boeing Co (NYSE: BA) placed final part orders for its 747 jumbo jets. fxn.ws NYSE:BA
General Motors Company’s (NYSE: GM) China quarterly sales dropped 5%. fxn.ws NYSE:GM
Global GDP to remain below pre-virus levels through most of next year. bit.ly
The Federal Reserve looks to Australia’s central bank for rate strategy. on.wsj.com
Airbus SE (OTC: EADSY) close to slashing jobs as output may drop 40%. reut.rs OTC:EADSY
Democratic nominee Joe Biden to end most of President Trump’s tax cuts. cnb.cx
Royal Dutch Shell plc (NYSE: RDS.A) to cut asset values by up to $22 billion. reut.rs NYSE:RDS.A
Lululemon Athletica Inc (NASDAQ: LULU) to buy Mirror for $500 million. bit.ly NASDAQ:LULU
By year end, corporate earnings may recover from the pandemic slump. bit.ly
Key innovation principles for delivering net-zero emissions, per the IEA. bit.ly
Laying out the worst-case scenario, a collapse of the financial system. bit.ly
Q2 projections are miserable as average S&P 500 earnings may decline up to 45%. bit.ly
The U.S. added 4.8M payrolls, while the unemployment rate shrunk to 11.1%. bit.ly
Global refinery utilisation rates in 2021-2024 may be 3% lower relative to 2019. reut.rs
Tesla Inc (NASDAQ: TSLA) beat analyst estimates for Q2 vehicle deliveries. reut.rs NASDAQ:TSLA
Brazilian regulators halt Facebook Inc’s (NASDAQ: FB) payments service. bit.ly NASDAQ:FB
Large U.S. banks pass the Fed's stress test, but must submit new capital plans. bit.ly AMEX:XLF
ASEAN response mitigated economic damage, but unlikely to offset credit risks. bit.ly
Sentiment: 22.2% Bullish, 32.0% Neutral, 45.9% Bearish as of 6/27/2020. bit.ly
Gamma Exposure: (Trending Lower) 3,223,157,668 as of 7/2/2020. bit.ly
Dark Pool Index: (Trending Lower) 46% as of 7/2/2020. bit.ly
Product Analysis:
S&P 500 (ES): TVC:SPX AMEX:SPY
Nasdaq 100 (NQ): TVC:NDX NASDAQ:QQQ
Russell 2000 (RTY): TVC:RUT AMEX:IWM
Gold (GC): AMEX:GLD
Crude Oil (CL): AMEX:USO AMEX:DBO AMEX:USL
Treasury Bonds (ZB): NASDAQ:TLT
Disclaimer:
This is a page where I look to share knowledge and keep track of trades. If questions, concerns, or suggestions, feel free to comment. I think everyone can improve, especially me.
In no way should this post be construed as investment advice.

RUT Triangle Pattern for a pending Wave (C) pullback The same predicament exist in the RUT as the SPX. RUT is forming a triangle pattern that could unfold into wave (C) corrective wave lower. The immediate pullback should take us back into 1250 downside target facing significant resistance ahead at 1542. One more push down into 1250 before we close out our bearish biased butterfly spreads.

RUSSELL 2000 INDEX BEAR FLAG SHORTBear Flags are Channel Ranges and they are repeatable trading chart patterns.
Bear Flag chart patterns will have a directional bias depending on the previous incoming trend (Short).
Each chart pattern will have defining trendlines of the support/resistance levels creating the pattern.
Whatever time frame you are trading this chart pattern, wait for a candle close outside of the trendline in the direction of the breakout candle. (Our time frame preference is the Daily chart).
Add volume indicator - Volume is the amount of $ that went into a particular candle or in Forex the # of trades that took place.
Add ATR indicator - Volatility is the amount of price movement that occurred. Use the ATR to measure the price movement.
When you see descending Volume bars and descending ATR line (which indicates volatility) this shows
a dis-interest in traders to invest in this pair creating consolidation which creates the chart pattern.
Trade Management after there is a breakout candle close.
1 - Position size (compare volume bar to volume ma line).
a - Breakout candle must be 100% of average volume for a full position size.
b - If 75% of average volume then ½ position size. (To find 75% of Volume
look at the charts volume settings – divide smaller # into larger # = 75%+)
2 - Enter two trades.
3 - SL for both trades will be 1.5 x ATR.
4 - 1st trade TP will be 1 x ATR.
5 - No TP on 2nd trade – letting profit run and adjusting SL to follow price.
6 - When 1st TP hit – move 2nd trade SL to breakeven.
7 - Adjust the 2nd trade SL to follow price.
*8 – After Breakout candle – if price closes back into chart pattern close trade
*9 - When breakout candle is more than 1 ATR from breakout candle open.
a - Enter 1st trade at candle close with ½ position size.
b - Enter 2nd trade with a pending limit order that is 1 ATR of breakout candle open.
c – Price should pullback to that pending limit order for 2nd trade.
d – If Price returns back into chart pattern close trade before SL is hit.

3 Risks Threatening to Weigh in on Stock MarketsLast week was all about fear vs greed. Which side would win. By the end of the week, we can see that the fear side has gotten the edge. What do I mean by fear vs greed? Well first off, those are the two primary emotions which effect markets. Those that are technical look at price action as the accumulation of these emotions. That is what is really being displayed on the charts: human and mass emotions. This is why many things which are seen as the future (3D printing, crypto etc) usually have a rise up due to the greed aspect and then generally have a substantial drop. Take a look at the charts of DDD and Bitcoin and look at the similarities. Now this does not mean that that tech will eventually be implemented, it is just the market does not really care in the short/medium term. Emotions is what dictates the price.
In terms of these emotions currently, we are seeing the fear sign, with the obvious headlines that I will cover in my 3 points, versus the greed side, which is based on monetary policy. The fact that central banks will keep printing money, will keep interest rates low for longer...it just means that the stock market will be the only place to go for REAL yield in the future. I have argues that many fund and money managers, who have been hiding in Bonds for the past 2-3 months, are now in a different world. They have seen interest rates cut quickly, and you just cannot be in bonds when your job is to make yield. That money will be driven into the stock markets. However, fear is weighing in on markets in the short and medium term here.
Let's us take a look at the charts of US equities. The markets did have a whip saw of a week last week. Up one day, then down the other. It really wasn't until the end of the week that we made a more concrete move down lower. Just want to mention that this upcoming week could see price ranging, or breakouts not carrying momentum. It is a week full of holidays as we have Canada Day on July 1st, and then the 4th of July Market closure on Friday. It will definitely be a shorter week and there won't be much liquidity.
The S&P is still holding the higher low on the daily chart at the 2950 level. There is a trendline you can draw, but it does not look as good as the trendlines you can draw on the Dow and Russell 2000 so keep that in mind. It does look like price wants to make a lower high here and retest then break below 2950. However, according to market structure, we can technically move higher as long as the 2950 zone remains valid. We need to see it break, and the fear aspect will be huge in making that happen.
I really like the Nasdaq for this week. On the daily chart, price momentum did not carry higher after making record all time highs. It seems that at least a pullback is due. Going down on the 4 hour chart, I love this reversal pattern potential. We have our head and shoulders pattern. Notice how on Friday close we did NOT break below the support/neckline. Our trigger is a break and CLOSE below this neckline. Ideally, I would want to see markets pop up a bit, create a green candle or a doji, before falling and closing below the neckline for an entry. This is my favourite chart pattern currently.
Both the Dow and the Russell are daily chart plays. Almost similar to the S&P but they are very close to their daily support levels. Another interesting aspect here are the trendlines. I don't really use trendlines for entries because they can be very subjective on how you draw them. I do look at them more for slope of change, and to connect higher lows in an uptrend. The key point is that if a trendline has at least 3 touches, it is quite a strong level. Many traders do watch trendlines and they will definitely be observing this retest and in the case of the Dow, break, of the trendlines. However, I prefer the aspects of pure market structure. Meaning as long as we remain above the higher lows, we are still in an uptrend. The bottom of these trendlines that we are testing also coincide with the large support zone we are holding to confirm the recent higher lows. This means that these zones are VERY important. Game plan is to await for a daily candle close below these levels. This would mean that we would not short these until Monday close. I am very strict on entries on breaks and closes because we have seen many examples of fake outs. We have seen price break down and looks lie it will continue. The FOMO traders chase it and price reverses trapping them. A fake out. Patience here is key and we will await the break and close.
So will we get these breaks this week? Yes of course it is possible. The only reservation I have is the shortened week due to holidays and the lack of liquidity this might provide. It would mean another choppy week and breakouts not carrying momentum forward. But there are plenty of risks here that are weighing in on the markets.
1) Covid Case Resurgences
We have been hearing about record covid case resurgences, but apparently this is not the second wave. We have seen states like Florida, and Texas pause their reopening process and reinstate restrictions. Now there are even talks of making masks mandatory if one leaves their home. The fear headlines have been unbelievable. It is almost as if the mainstream media wants the markets to fall. I have been trading for 7 years, I have not seen headlines like this. Marketwatch had headlines such as "we are in deep trouble" and "economic depression is only just beginning". None of these headlines came out when we were in the midst of the pandemic. To me it is a bit odd but maybe I am thinking too much about this. Media has been peddling the fear and the market does not like it.
There is now talks of a second round of lock downs. Plenty of things this would do. First of all, it would ensure most small businesses fail and become debt slaves. Corporations will get more powerful. People's mental health and state will drop dramatically, in fact, some are saying many would rebel if a second lock down is imposed. The social issues will be huge and I have been talking and warning about these for some time. They will worsen regardless due to the monetary policies central banks have implemented.
The fear is that these resurgence in cases will dampen the hope of any economic recovery. There will be no V shaped recovery. Many larger industries will need more bailouts just to survive. There will be a second round of layoffs. It really is scary stuff and would probably even surpass great depression like levels.
2) US China Trade War
Being a bit of a contrarian myself, my belief is that markets actually fell last week more on the US and China trade deal fears and uncertainties rather than covid surges. Markets have already swatted away the pandemic and great depression like economic data. They could do so once again. The geopolitical stage is on watch. Last week we have Peter Navarro come out saying the trade deal is "dead". The clean up campaign afterwards was epic. Navarro denied ever saying that even when it was caught on video, and the President himself came out saying the deal is intact. Everything to keep markets propped.
Well on Friday, the Chinese came out and once again reiterated that they may back out from the trade deal if the US meddles with affairs in Hong Kong and Taiwan, which the Chinese say falls under their sphere of influence. China has threatened this many times before, but most people probably now know the trade deal is dead after what Navarro said. The truth is out. My followers and readers know my thoughts on this. China can be patient because they will wait for the elections and perhaps a weaker US President from the Democratic side. They also are pulling the strings. Chinese strategists know that President Trump needs to keep this charade of a trade deal intact because he does not want stock markets to tumble. Markets are his achilles heel. If markets are not up during the Fall, his slogan of "Keeping America Great" takes a hit. The Chinese know that if markets fall on hope fading of a trade deal, it will be President Trump desperate for a trade deal. The Chinese can then dictate the terms in their favour. In all honesty, China buying more US agriculture is not an improvement. They can always walk away and buy from Brazil or Russia, which they have threatened. The US needs to be more aggressive if they want to win this trade war.
My advice for the President is give China an out. Do the unexpected. China does not expect the President to come out saying the deal is cancelled due to the markets. If the US pulls out, China will be upset. Yes, both US and Chinese markets will take a hit, but I think they will rebound due to hopes of an actual REAL deal. Right now most people know that this deal is a farce. We have repeated the narrative of deal struggling and deal back on. Would not be surprised if we see "China trade deal going well" headline floated out to try and prop markets up. The only thing is when will the market stop buying it?
3) Black Swan event
My followers and readers know my opinion on markets. With the discrepancy between the stock markets and the real economy, fundamentals are out the window. Markets are moving up due to a hunt for yield. This is why markets have gone up even with all the bad news thrown at it. It doesn't matter. We have even seen the Fed enter the markets buying bond ETF's and even individual corporate bonds. There is a case to be made the Fed could be using repo to give banks excess funds so they can then turn around and use them to buy stocks for profits and propping. This is the managed market environment we are in. The only thing that can bring this down is a black swan event. The fear factors I mentioned in 1 and 2 can play out. Especially if the President does rip up the trade deal. No one would be expecting it. This is the crux of a black swan event. They are unpredictable and take the markets by surprise.
There are so many candidates. It could be a geopolitical issue like North Korea, the Middle East, and/or India and China. It would even be election news. Biden or Trump overtaking polls etc although I would be careful with this. When President Trump won the elections in 2016, many thought this was a black swan event. Markets initially fell, but recovered and moved up higher dramatically.
What I would be watching is for a financial event. So far the Fed has been throwing money at everything, propping banks and corporations. We have seen some companies going under like Hertz and GNC. It would have to be a bank issue that does this. People are saying this is a financial crisis like 2008, but we are missing our Lehman Brothers moment. Something that would impact the credit/debt markets which have ballooned to extraordinary levels now. The dangers of this are real even though the Fed has implemented tons of policies to prevent this. This is just my opinion, but I believe these things just have a way of playing out even with manipulation.

June 28 Market Update | Technical, Fundamental, NewsDescription:
An analysis for the week ahead.
Points of Interest:
Gap Above 78.6% Retracement; 100% Projection And VWAP Anchored From 3/23 At $2,850; Balance Below $2,975.
Technical:
Broad-market equity indices resolved a week-long balance area to the downside, albeit under weak selling. The S&P 500 managed to one time frame lower, as evidenced by the lower highs and lows, and closed the week off below its month-to-date and week-to-date volume weighted average price benchmarks.
Recapping last week’s action, Monday’s session closed higher without any involvement from stronger buyers. During the overnight session, before Tuesday’s regular trading, news regarding U.S. and China trade relations roiled markets. Later, statements regarding the relations were retracted, and markets retraced more than 100% of their move down. After the overnight news-driven shakeout, the market failed to get any real traction during regular trading.
On Wednesday, markets liquidated on news regarding a contraction in global economic growth, later accepting prices and closing near the lows. The rotations lower were mechanical, indicative of short-term trading money.
Thursday’s activity, on the other hand, was mostly responsive, with end-of-day economic news helping fuel a spike that erased some of Wednesday’s selling. In the evening session, alongside Federal Reserve balance sheet news, markets returned to prior day value, rejecting the end-of-day spike. After the noisy overnight, markets opened Friday, liquidated, and closed near the lows.
Overall, despite the market losing ground, the selling was not all too intense as evidenced by the mechanical rotations and weak migration of value. Every time the market attempted to go higher, or lower, it lacked conviction, and would often lose steam into the close.
Adding, the presence of an overwhelming number of traders on social media salivating at the notion the market may experience another crash is a huge red flag and may point to the incompletion of a longer-term uptrend. Important to note is the relative strength of growth versus the weakness of the energy and financial sectors. That said, though the immediate near-term trend is lower, higher prices could come just as easily on some good news. For a healthy continuation, sellers need to step up and transact in higher volumes at lower prices.
Scroll to bottom of document for non-profile charts.
Key Events:
Home Sales; Consumer Confidence; ADP Employment; Construction Spending; Nonfarm Payrolls; Initial Claims; Trade Deficit.
Fundamental:
IMF lowers global growth projections for 2020. bit.ly
Bayer AG (OTC: BAYRY) to pay over $10B to settle weedkiller claims. bit.ly OTC:BAYRY
Users are fed up with Facebook, Inc (NASDAQ: FB). bit.ly NASDAQ:FB
Russia to ramp up oil production after pandemic recovery. reut.rs
Russian rate cut to ease pressure on bank margins. bit.ly
B3’s pact with CME Group, Inc (NASDAQ: CME) is credit positive. bit.ly NASDAQ:CME
Credit implications of one-off debt increases mitigated by debt affordability, low rates. bit.ly
One opinion suggests the Fed is not the cause of the recent broad market rally. bit.ly
Twitter, Inc (NYSE: TWTR) user surge may be permanent. bit.ly NYSE:TWTR
Top 100 companies prosering amidst the pandemic. on.ft.com
Four factors that could weigh on recovery, spark a depression. bit.ly
Bond market looks to a tech-centric future for increased efficiency. reut.rs
43% of firms that received PPP could be out of cash in a month or less. bit.ly
65% of the general population over the age of 18 wouldn’t mind returning to lockdown. bit.ly
73% of economists expect economic drop to be followed by a quick recovery. bit.ly
T-Mobile U.S., Inc (NASDAQ: TMUS) shares priced at $103 amid SoftBank sale. NASDAQ:TMUS
U.S. targets $3.1B of EU and U.K. imports for new tariffs. bloom.bg
Chinese imports of U.S. goods rise, while investment into China continues. reut.rs
Tesla, Inc (NASDAQ: TSLA) signs long-term supply deal over cobalt. reut.rs NASDAQ:TSLA
Royal Dutch Shell plc (NYSE: RDS.A) plans climate-driven restructuring. reut.rs NYSE:RDS.A NYSE:RDS.B
9 companies in Phase 1 of COVID-19 clinical trials, while two are in Phase 2. bit.ly
Realtor.com data shows views per property in suburban zip codes grew by 13%. bit.ly AMEX:IYR
Ackman seeks $3B raise for largest-ever blank-check company. reut.rs
Industrial power demand in China rises above 2019 levels for the first time. bloom.bg
1-in-6 young people have stopped working since the onset of the COVID-19 crisis. bit.ly
Carnival Corp (NYSE: CCL) CEO remains invested despite the uncertainty. bit.ly NYSE:CCL
Americans increase deposits as banks cut back on lending. bit.ly
Restructuring supportive of Deutsche Bank AG’s (NYSE: DB) asset performance. bit.ly NYSE:DB
Greek banks increase problem-loan outsourcing to credit servicers, a credit positive. bit.ly
Startup ecosystems rated by performance, funding, connectivity, talent, and knowledge. bit.ly
Should you be inclined to sell the rally? bit.ly
Amazon.com, Inc (NASDAQ: AMZN) to acquire self-driving car startup Zoox. bit.ly NASDAQ:AMZN
German court orders Facebook, Inc (NASDAQ: FB) to stop data sharing. bit.ly NASDAQ:FB
Amazon.com, Inc (NASDAQ: AMZN) to take 16% stake in U.K. food delivery firm. cnb.cx NASDAQ:AMZN
Companies get caught up in the reparations debate. bit.ly
BlackRock, Inc (NYSE: BLK) slashes fees for its largest ETF. on.wsj.com NYSE:BLK AMEX:SPY
American Airlines Group, Inc (NASDAQ: AAL) warns flights may be crowded in July. reut.rs NASDAQ:AAL
Verizon Communications, Inc (NYSE: VZ) pulls ads from Facebook and Instagram. bit.ly NYSE:VZ
Unprecedented aging of U.S. population to rein in growth, inflation, and interest rates. bit.ly
Credit card industry reins in balance-transfer offers as banks fear defaults. cnb.cx
ETF trading affects underlying stocks a lot less than expected. bit.ly
Sentiment: 24.1% Bullish, 27.0% Neutral, 49.9% Bearish as of 6/27/2020. bit.ly
Gamma Exposure: (Trending Lower) 626,711,354 as of 6/27/2020. bit.ly
Dark Pool Index: (Trending Lower) 45.8% as of 6/27/2020. bit.ly
Product Analysis:
S&P 500 (ES): AMEX:SPY TVC:SPX
Nasdaq 100 (NQ): NASDAQ:QQQ TVC:NDX
Russell 2000 (RTY): AMEX:IWM TVC:RUT
Gold (GC): AMEX:GLD
Crude Oil (CL): AMEX:USO AMEX:USL AMEX:DBO
Treasury Bonds (ZB): NASDAQ:TLT
Disclaimer:
This is a page where I look to share knowledge and keep track of trades. If questions, concerns, or suggestions, feel free to comment. I think everyone can improve, especially me.
In no way should this post be construed as investment advice.

IWM - ishares russell 2000 etf The trend is bullish, the trendline has been violeted 2 times (weakness signal).
Wait that the price reaches the level 134 USD and then see: if the level will be broken (in a daily candle stick - perhaps closure of two days price below that support level) the idea is to go short, otherwise go long (the level of circa 134 USD will work as support).
Generally in Technical Analysis, it is easier for a price to follow their major trend (upward), so always trying to invest in the trend direction, if it is possible.

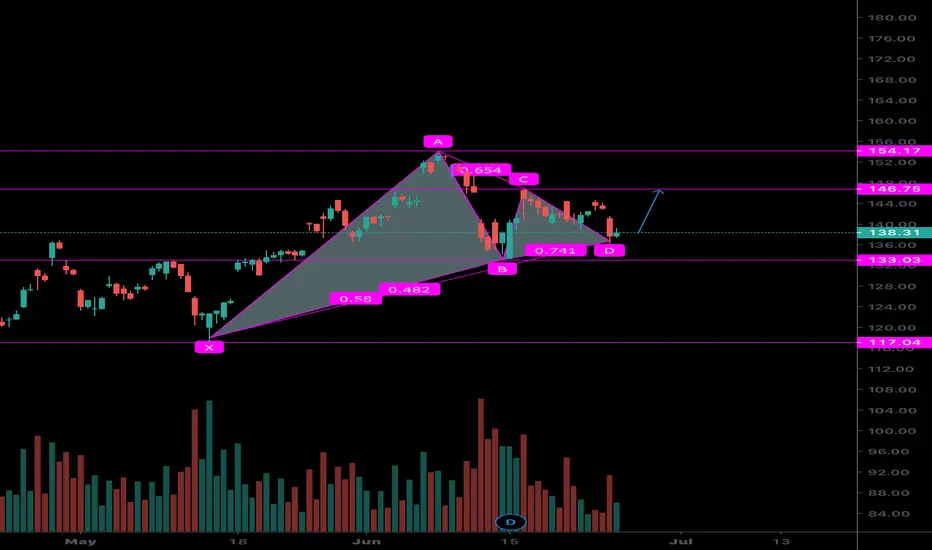
Russell 2000 - Could we get one more high?6/27/20. SPX and Nasdaq are dominated by a handful of large caps stocks and they maybe unreliable.
Russell2000 is made of mid cap 2000 companies and may represent better picture.
White path = we topped in cycle 1 and in the process of trace to cycle 2
Yellow path = we go up for one more higher high but that may present A=C setting up for potential larger move back down to test the March low.
Know your parameters. Risk vs Reward.

Russell 2000 broke its 3 month long bear flagJust needs one push down now, already breaking the bear flag.


Russell Bear Flag Breakdown and a Good Reversal FibMuch like the ES and NQ futures that I discussed tonight, the Russell futures may be rolling over as well. With this chart, there are two ways I see to interpret the "bear flag" formed from the March lows. As drawn now, more candles are captured by the lower channel, but to do that the flag has been violated three times, which is a little unorthodox.
The other way is to lower the lower channel to capture the three breakdowns, but in doing so, we might miss an important clue that faces us presently, so I have left it as it is.
In each of the first two breakdowns out of the flag (red arrows), the index was able to recapture the channel quickly, in a matter of a couple of days with a large green candle thrust.
The important matter I want to point out is the third breakdown (green arrow). It, too, tried to recapture the channel but ultimately failed do so and then backtested it from below and failed that too. This is why I prefer drawing this chart in this way, because it is then in alignment with the breakdowns we see in the NASDAQ and S&P 500.
And finally, this index is a bit unique in that it has a much cleaner fib retracement, having kissed the 78.6% fib before this last, and possibly final breakdown.

That down candle a week ago is still "bringing back memories"?Equities tried rallying above it but have so far failed. Note how Russell futs trade stuck below the highs of that big candle last Thursday. Similar is to be seen in S&P. Watch the lower part of the channel for support in case we turn lower.
Upside, watch recent highs as resistance.

RUT corrective pullback [WAVE C]On the minor time frame, wave (C) corrective is still in progress with the resistance level at about 1540 targeting the 1300 downside target. We have seen quite a sharp decline in higher degree into wave i. 1542 resistance must hold to keep this corrective pattern alive.

Russell 2k Target Hit +6.99% (Update on Position)Great gain, no drawdown. Well done to all that took this trade with me.

June 14 Market Update | Technical, Fundamental, NewsDescription:
An analysis for the week ahead.
Points of Interest:
4-Day Island; Thursday Liquidation; Balance Area Below S&P 500 $2,975; Friday Corrective Action.
Technical:
Risk-off sentiment after equity indices erased an earlier gap that occurred on hopeful economic data. The island of balance left behind will offer resistance on any correction higher. If the market trades through that area, then sentiment has changed and the initiative activity that drove prices lower is no longer present.
Recapping last week’s action, Monday overnight traded to a low-volume area from Friday creating a ledge at $3,211 that the market later moved through, into the close. Prices above the ledge were rejected after Tuesday's overnight auctioned below the breakout point, down to resting liquidity at $3,190.
Wednesday's FOMC meeting officially ended the move higher as volatility increased and the market closed lower. Thursday displayed a rush from risk as selling was persistent and strong into the close.
Friday failed to generate continued selling below $3,000, closing above a prior balance area and VWAP.
Putting everything together, the picture points to the potential for a correction up to the coming Friday option expiration. If liquidation continues into the coming week and value moves lower, then the near-term bullish narrative is no longer intact.
Scroll to bottom of document for non-profile charts.
Key Events:
New York Federal Reserve’s Business Conditions Index; Retail Sales; Initial Claims; Industrial Production; Housing Starts; Housing Permits; Philadelphia Federal Reserve’s Business Index; U.S. Current Account Deficit.
Fundamental:
Short-term speculative derivatives activity results in more hedging and volatility. bit.ly
COVID-19 coronavirus data may have not prompted recent selling. bloom.bg
Keeping unproductive companies going lowers long-run economic growth. bloom.bg
The Congressional Budget Office sees virus relief reaching $2.2 trillion this year. bloom.bg
U.S. gasoline consumption rebounds, led by removal of mobility restrictions. reut.rs
May default volume brought YTD default volume to its highest since May 2009. bit.ly
Coronavirus obliterated the best African-American job market on record. on.wsj.com
Fed to buy as many bonds as necessary to keep yields at desired level. bit.ly
After-tax profits for retail companies fell more than expected. bit.ly
Apple Inc (NASDAQ: AAPL) to stop using Intel Corporation (NASDAQ: INTC) chips. bloom.bg NASDAQ:AAPL NASDAQ:INTC
Incoming shift to digital may grow Amazon Inc’s (NASDAQ: AMZN) AWS revenues. bit.ly NASDAQ:AMZN
The U.S. saw its largest decline in business owners between February and April. bit.ly
BP plc (NYSE: BP) to cut global workforce by 10,000. bit.ly NYSE:BP
Unrest and inequality pose fiscal and governance credit risks for states and cities. bit.ly
Airlines unlikely to fully recover before 2023, face structural changes. bit.ly AMEX:JETS
The U.S. consumer price index continues falling, sparks talk of deflation. bit.ly
Flat yield curves are a key threat to bank margins as rates stay low for longer. bit.ly
Hong Kong’s relief measures reduce pressure on bank asset quality. bit.ly
New SEC rules on crowdfunding a boost to capital raising for startups. bit.ly
Auctioneers race to unload oil equipment as drilling interest dries up. reut.rs
Senators draft plan to reform new plane design approvals. reut.rs NYSE:BA
American Airlines Group Inc (NASDAQ: AAL) to halt cash burn by year-end. reut.rs NASDAQ:AAL
Goldman Sachs (NYSE: GS), Morgan Stanley (NYSE: MS) downgrade Tesla Inc (NASDAQ: TSLA) noting current valuation underestimates risks including increased competition. reut.rs NYSE:GS NYSE:MS NASDAQ:TSLA
The Fed expects household finances to suffer persistent fragilities due to shock. reut.rs
U.S. consumer confidence rises while unemployment shadow lingers. reut.rs
Fed Chair Powell is devoted to the return of a strong labor market. reut.rs
Hertz Global Holdings Inc (NYSE: HTZ) seizes on speculation with stock sale. reut.rs NYSE:HTZ
Sentiment: 34.3% Bullish, 27.7% Neutral, 38.1% Bearish as of 6/14/2020. bit.ly
Gamma Exposure: (Trending Higher) 5,515,247,892 as of 6/14/2020. bit.ly
Dark Pool Index: (Trending Higher) 49.7% as of 6/14/2020. bit.ly
Product Analysis:
S&P 500 (ES): AMEX:SPY TVC:SPX
Nasdaq 100 (NQ): NASDAQ:QQQ TVC:NDX
Russell 2000 (RTY): AMEX:IWM TVC:RUT
Gold (GC): AMEX:GLD
Crude Oil (CL): AMEX:USO AMEX:DBO AMEX:USL
Treasury Bonds (ZB): NASDAQ:TLT
Disclaimer:
This is a page where I look to share knowledge and keep track of trades. If questions, concerns, or suggestions, feel free to comment. I think everyone can improve, especially me.
In no way should this post be construed as investment advice.

Stock Markets: Bear Market or Pullback?Volatility returned near the end of last week, seeing declines that we have not seen since March of this year. There were signs of this beginning with the topping patterns on the stock market charts on the 4 hour ( mainly the Russell 2000 which tends to lead the large US indices), this dramatically led to a major sell off on Thursday. We saw a roller coaster of a ride in markets on Friday, and this should have been expected given price action on Thursday. It was definitely one for the day traders and short sellers to pile in thinking this was the bear market most believe it should be.
My readers know that the bear market on all the US market indices were nullified with the rejection of the 61.8 fibonacci on the weekly chart, a zone of much importance as I highlighted in the past, and it did take us a few weeks to break through this on the S&P and the Dow. Just simple market structure. For a bear market, we needed a lower high to be confirmed and this did not happen. As previously mentioned, all time record highs were expected by me. This seems more like a pullback.
Now that is not to say this will be smooth sailing. There is one thing that can bring this market down: a black swan event. It would have to be so out of left field, that it would overwhelm the Federal Reserve's trading desk, and those of the large banks. The media is saying that markets are moving down due to riots and protests, to the Fed's dovish outlook, and also to the fact that a second wave of covid cases may hamper US economic recovery on the re-openings that are occurring.
I want to remind my readers that the real economy and the stock markets are entirely two different entities. This market has shrugged off a pandemic, great recession like unemployment, millions of layoffs and record breaking economic data. It seems like the buy the dip and stonks days are back. Rationality is out the window: Tesla breaching $1000 per share, Chesapeake Energy going from $15 to $70 then back to $16 dollars, and Hertz getting a bid are all signs of this. Markets are the only pace to go for yield. For real yield.
Let us look at the Fed's words. Was anyone expecting Fed chair Powell to say the economy is recovering after that unexpected jobs data? Many know that the Fed cannot normalize given all this new debt that has been issued. Do not forget the fiscal side too. Governments want low interest rates to service all this new debt especially when tax revenues will be low or non-existent. Low interest rates are here to stay for a long time. Powell is telling us at least through to 2022. In my opinion negative rates are coming, but as we know, these do not work. The Keynesians argue that negative rates do not work in Europe and Japan not because of the policy, but due to the fact rates were not cut deep into the negative enough, and not enough money was printed. Digital money is seen as the solution as it would force people to keep their money in banks and therefore pay the banks. The Keynesians think this would force people to spend money to create inflation and growth. You must punish the savers.
In financial markets, this means that bond yields will be suppressed. I have argued in the past that bonds are not for yield now. Bonds are held for capital appreciation betting on lower interest rates. We will see yields drop further as speculators buy bonds anticipating negative interest rates in the US and other western nations in the future.
So once again, I ask you: where do you go for yield? Fund managers need to make money, and they will not make much in fixed income anymore. Stocks are the only place to go, and the Fed has created an environment to force money into stocks. All the programs they have instigated is to keep everything propped. Propping corporations, propping small businesses, propping other countries with their Dollar swap lines, propping banks (maybe even hedge funds as some speculate) with repo. Do not forget the fiscal side. The US government is expected to announce another sort of stimulus program in late July. One of the highlights of Powell's FOMC rate decision on Wednesday was he implored the government to do more. Hinting that the Fed does not want to go down a path it cannot turn back from. Propping everything and being buyers of last resort. Nonetheless, the Federal Reserve has pledged to keep stock markets propped. Wall street knows this. They know the party is not over. They will continue to ride this to make unbelievable amounts of money, and when it is over, they will blame the central banks.
So I said a lot about the fundamentals, but many of you already know my opinion on that. Let's look at the technicals.
Just a quick lesson on market structure that my readers are already familiar with. Remember, markets are in a trend as long as they hold the current swing. In an uptrend that would be a higher low and in a downtrend that would be a lower high. In the case of the S&P 500, the higher low is at the 2940 zone. We have not broken that, which means this is just a pullback in the uptrend. We almost touched that support on Friday, but you can see the buyers are beginning to step in. We have formed a doji as well indicating the battle between the bears and the bulls. Closing green too was quite the sign too. For the swing traders, take a look at the 4 hour chart. Look how we struggled to close below the recent lows. A lot of action at this major zone.
The Dow is also at a very significant level. The big 25000 zone, which also is where the higher low is located. I expect buyers to step in here and we are already seeing signs of this.
I would watch the Russell for next week. We did in fact close below the higher low on Thursday, but then recovered on Friday and potentially created a false breakout. You can see it is a very key support area as well.
I want to share some other European equity charts which seem to show a pullback to a previous support level.
(Notice the fake out on the UK FTSE)
So how do we play this? Watch price action come Monday. I have said the 4 hour charts are showing the buyers step in, but the daily chart trumps the lower time frames. Especially when we are at key DAILY chart levels. Await how price closes on the daily candle on Monday. I expect to see large wicks, or perhaps even indecision doji candles. We will assess as these candles close.
In summary, this pullback has been welcomed. These markets moved up too fast and needed a pullback. From here I expect to see money jump back in given what I mentioned on the monetary side. I do believe issues will worsen as we head towards the US elections in Fall, but this market has disconnected from the real economy. Chase the yield and know the central banks have got your back.

RUSSELL watch 1460whether it's a B or a 2, we would retrace 50% to 61% of the first drop and we should bounce back somewhere between 1450-1475


RUT remaining bearish against this resistance level
RUT us forming an extended wave v that points the wave (v) upside target of 161.8% retracement at 1430 level. Wave v must hold at 1542 to the the Corrective Flat Pattern valid. Expect this terminal rally into our final resistance zone before the decline starts.
Notice that the RUT is weaker than the S&P. Will the coming pullback continue this trend and see bear markets in both as US debt is shunned by global investors as a store of value?

RUSSELL Wave A or wave 1?From my last RUSSELL analysis I was mentioning the eventuality of an end of W5. This seems to happen now.
I am now looking at this downward leg which could a simple ABC correction if A bounces back at the level of the previous 4 wave...
Or if it slips lower confirming my theory of a bear market complex correction.
